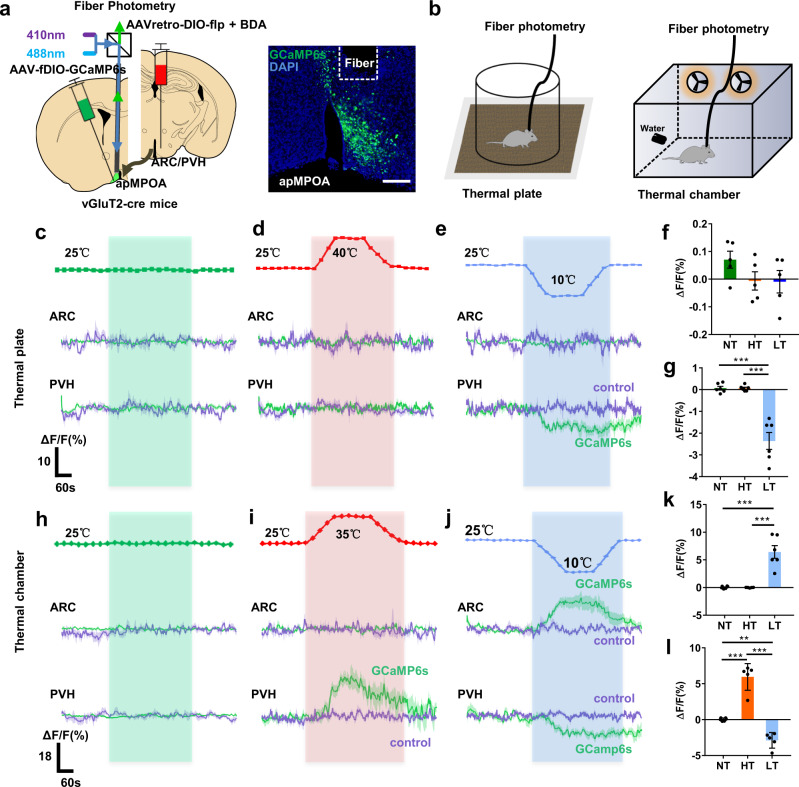
Fig. 6. PVH and ARC-projecting apMPOA neurons are responsive to ambient thermal exposure, but not to local stimuli.
a Schematic and representative coronal images of AAVretro-DIO-flp virus injection into the PVH and ARC (ARC shown here) and AAV-fDIO-GCaMP6s into the apMPOA in vGluT2-cre mice. The optical fiber was placed 200 µm above the apMPOA neurons. Red fluorescent BDA (biotinylated dextran amines) was mixed into the virus to indicate the injection range. Image representative of n = 12 mice. Scale bar, 100 µm. b Schematic of thermal exposure by temperature-controlled plate and chamber. c–e GcaMP6s (mean, green line; SEM, green shading) and control (mean, purple line; SEM, purple shading) signal changes (ΔF/F%) of the ARC (top) and PVH-projecting (bottom) apMPOA neurons in response to local thermal stimuli: neutral (25 °C, green dotted line in Fig. 6c), hot (25 °C → 40 °C, red dotted line in Fig. 6d), cold (25 °C → 10 °C, blue dotted line in Fig. 6e). h–j GcaMP6s (mean, green line; SEM, green shading) and control (mean, purple line; SEM, purple shading) signal changes (ΔF/F%) of the ARC (top) and PVH-projecting (bottom) apMPOA neurons in response to ambient thermal exposure: neutral (25 °C, green dotted line in Fig. 6h), hot (25 °C → 35 °C, red dotted line in Fig. 6i), cold (25 °C → 10 °C, blue dotted line in Fig. 6j). Bar graphs show mean ΔF/F response of ARC (thermal plate: f thermal chamber: k) and PVH-projecting (thermal plate: g thermal chamber: l) apMPOA neurons in a 5 min window after the onset of thermal exposure. One-way repeated-measure ANOVA and post hoc LSD multiple comparison, g all ***p < 0.001, k all ***p < 0.001, l: **p = 0.002, ***p < 0.001. n = 6 for both PVH and ARC groups, but n = 5 animals were included into statistical ANOVA in ARC groups in cold plate and hot chamber, PVH group in cold chamber and hot chamber due to incomplete data. All error bars show SEM.

