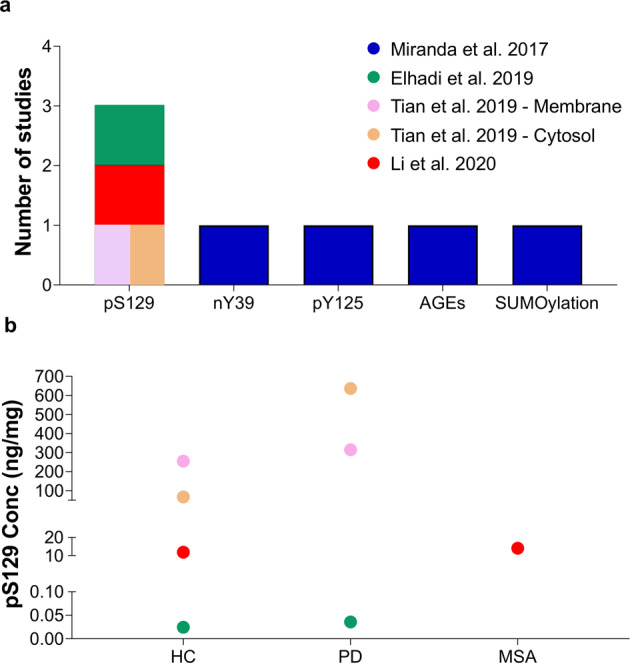
Fig. 6. aSyn PTMs in RBCs.

a Number of studies that reported the identification of different aSyn PTMs in RBCs. b Variability of pS129 levels across the different studies comparing PD to HC or to patients with other synucleinopathies such as MSA. In this graph, it is also depicted that RBC pS129 levels differ between the membrane and cytosol fractions149. Each dot represents the mean levels of pS129 aSyn reported in each study. The levels of aSyn PTMs such as nY39, pY125, AGEs or SUMOylation are not depicted in the figure because they were assessed only by dot and Western blotting analysis146; no assay for obtaining an “absolute” quantification was carried out. The legend/color code in a corresponds also to b.
