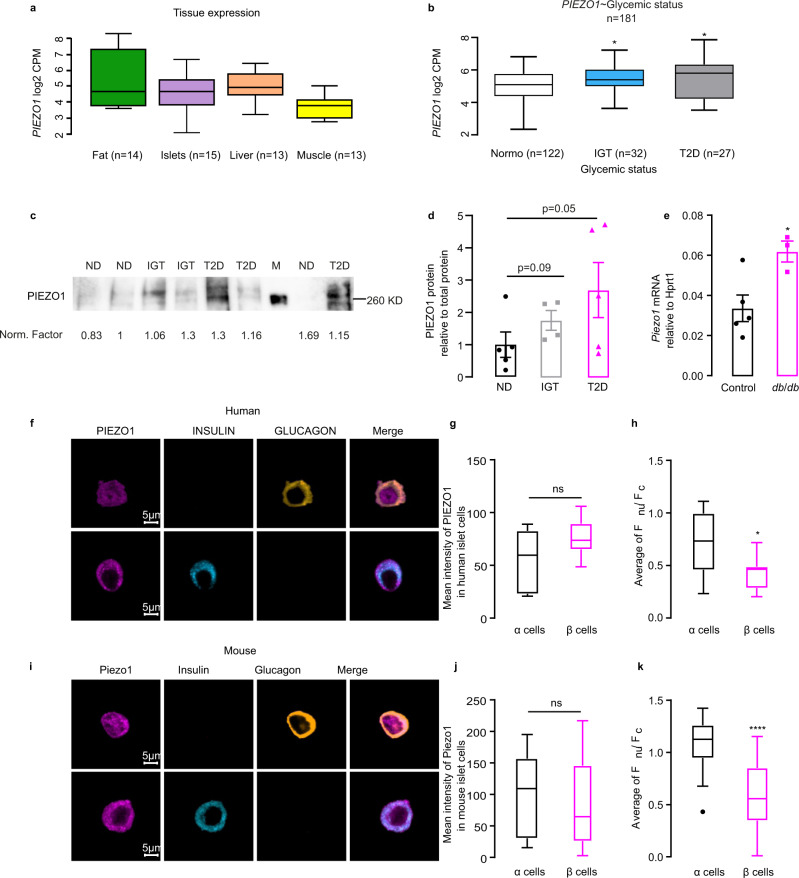
Fig. 1. Piezo1 is highly expressed in diabetic islets.
a RNA-seq data for PIEZO1 in fat, pancreatic islets, liver and muscle from human tissues. CPM: count per million. b RNA-seq data for PIEZO1 in samples of human islets from healthy donors (ND; n = 122), donors with impaired glucose tolerance (IGT; n = 32, p = 0.023) and donors with type 2 diabetic (T2D; n = 27, p = 0.015). c Immunoblot for PIEZO1 of human islets from ND (n = 5), IGT (n = 4) and T2D (n = 5) donors. d Densitometry quantification of PIEZO1 protein normalized to total protein in c, PIEZO1 expression in ND was set to 1. e Piezo1 expression in mRNA level in C57BL/6J (Control; n = 5) and db/db mouse islets (n = 3). f Immunostaining for PIEZO1 (violet) in human islet α- and β cells. Glucagon (yellow) and insulin (light blue) served as the marker for α- and β cells, respectively. g Quantification of mean intensity of PIEZO1 in f (n = 7 α cells and 9 β cells). h The average ratio of fluorescence for PIEZO1 in the nuclear over that in cytosol calculated for f (n = 11 α cells and 11 β cells, p = 0.0109). i Same as in f but in dispersed mouse islets. j Quantification of mean intensity of PIEZO1 in i (n = 26 α cells and 30 β cells). k. The average ratio of fluorescence for PIEZO1 in the nuclear over that in cytosol calculated for i (n = 26 α cells and 30 β cells, p < 0.0001). Data are presented as dot plots with mean values ± SEM superimposed for figures d, e and box Tukey plot in a, b, g, h, and j, k. The minima and maxima of the box Tukey are the minimum and maximum data excluding the outliers, the center is the median, the bounds of box are the 25th (Q1) and 75th (Q3) percentiles, whiskers are the farthest points that are not outliers (i.e., that are within 3/2 times the interquatile range of Q1 and Q3). In b, statistical significances were evaluated by one-way ANOVA multiple comparisons. Unless otherwise indicated, statistical analysis was performed using a two-tailed Student’s t-test except for panel d where a one-tailed t-test was used. In b, e, g, h, j, k, *p < 0.05, ****p < 0.0001, ns not significant.

