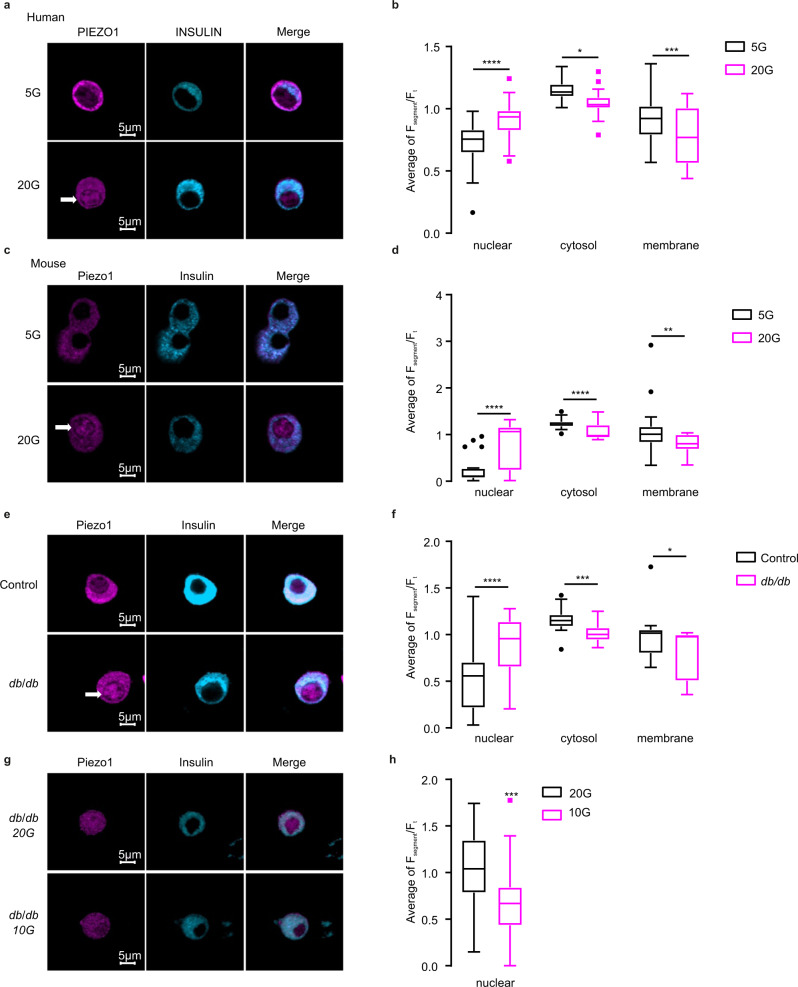
Fig. 2. High glucose induces the translocation of PIEZO1 into the nucleus.
a Immunostaining of PIEZO1 (violet) and Insulin (light blue) in human islet β cells incubated for a total of 96 h (72 h as intact islets and 24 h after dispersion into single cells) with 5 or 20 mM glucose (5 and 20G). b The average ratio of fluorescence for PIEZO1 in the nucleus, cytosol and membrane normalized to the total PIEZO1 fluorescence calculated for a (n = 34 and 38 cells for 5 and 20 mM glucose (5 and 20G), respectively), p values for the comparison between 5 and 20G for nuclear, cytosol or membrane are <0.0001, 0.0187, 0.0004, respectively. c Immunostaining of PIEZO1 (violet) and insulin (light blue) in mouse islet β cells incubated for 48 h with 5 or 20 mM glucose (5G and 20G). d As in b but for data in c (n = 24, 40 cells for 5 and 20 mM glucose (5 and 20G), respectively, p < 0.0001 for the comparison of fluorescence intensity in nuclear or cytosol with 5/20 mMG treatment, p = 0.0045 for that in membrane), p values for the comparison between 5 and 20G for nuclear, cytosol or membrane are <0.0001, <0.0001, 0.004, respectively. e Immunostaining of PIEZO1 (violet) and insulin (light blue) in C57BL/6J (Control) and db/db mouse islet β cells. Islets were dissociated into single cells immediately after isolation and cultured in standard medium (10 mM glucose) for 24 h prior to immunostaining. f As in b but for data in e (n = 21 and 23 cells for Control and db/db, respectively). g Immunostaining of PIEZO1 (violet) and insulin (light blue) in db/db mouse islet β cells cultured with 20 or 10 mM glucose for 72 h, p values for the comparison between 5 and 20G for nuclear, cytosol or membrane are <0.0001, 0.00017, 0.027, respectively. h The average ratio of fluorescence for PIEZO1 in the nucleus normalized to the total PIEZO1 fluorescence calculated for g (n = 23 and 22 cells for 20 and 10 mM glucose, respectively, p = 0.0009). Data are presented as box Tukey plot. The definition of box Tukey is as indicated as in Fig. 1. Statistical significances were evaluated by a two-tailed Student’s t-test in b, d, f, h *p < 0.05, **p < 0.01, ***p < 0.001, ****p < 0.0001, ns not significant.

