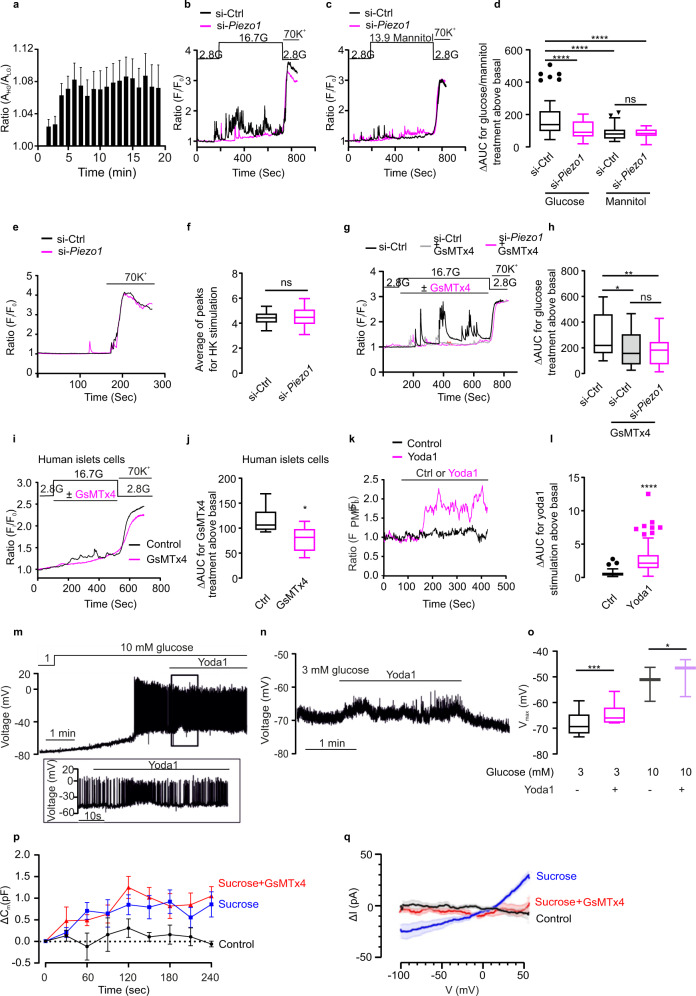
Fig. 4. Piezo1 controls β-cell cytosolic Ca2+ homeostasis.
a INS-1 832/13 cells were initially incubated at 2.8 mM glucose with the dye CFSE. The cells were superfused with medium containing 2.8 mM (n = 17) or 16.7 mM (n = 16) glucose while recording CFSE fluorescence. The cell area under 16.7 mM glucose relative to the cell size in cells that were maintained at 2.8 mM glucose throughout to compensate for dye bleaching. b [Ca2+]i in INS-1 832/13 cells (measured using Fura-2 fluorescence; Fi) normalized to the basal (F0) in cells superfused with medium containing 2.8 or 16.7 mM glucose in control cells (si-Ctrl; black) and after silencing of Piezo1 (si-Piezo1, red) and following stimulation with 70 mM K+ as indicated. c As in b but 13.9 mM mannitol was added to the extracellular medium in the continued presence of 2.8 mM glucose as indicated. d Average of increase in AUC above basal (ΔAUC) in the presence of glucose (total: 16.7 mM) or mannitol (13.9 mM in the presence of 2.8 mM glucose) for b and c in control (si-Ctrl) cells and after silencing of Piezo1 (si-Piezo1) (n = 54, 47, 41 and 31 cells, respectively, all the significant p values are <0.0001). e As in b but before and after increasing extracellular K+ ([K+]o) to 70 mM as indicated. f Peak Fi/F0 above basal upon 70 mM K+ stimulation for e (n = 29 cells for si-Ctrl and si-Piezo1, respectively). g [Ca2+]i in INS-1 832/13 cells (measured using Fura-2 fluorescence; Fi) normalized to the basal (F0) in cells superfused with medium containing 2.8 or 16.7 mM glucose (G) in control cells (si-Ctrl) without (black) or with (gray) GsMTx4 and after silencing of Piezo1 (si-Piezo1, red) with GsMTx4 and following stimulation with 70 mM K+ as indicated. h ΔAUC for the effects in response to glucose with or without GsMTx4 in control cells (si-Ctrl) or with GsMTx4 after silencing of Piezo1 (si-Piezo1) induced increase in Fi/F0 for g (n = 43, 31 and 34 cells, respectively, p values for the comparison between si-Ctrl and si-Ctrl/ si-Piezo1 with GsMTx4 are 0.029, 0.0028, respectively). i [Ca2+]i in human β cells superfused with medium containing 2.8 mM glucose or 16.7 mM glucose (G) in the absence (black) or presence (red) of GsMTx4 as indicated. The experiment was concluded by increasing [K+]o to 70 mM. j ΔAUC for the effects of increasing glucose from 2.8 to 16.7 mM in the absence (black) or presence of GsMTx4 (red) for i (n = 7 and 8 cells for control and GsMTx4, respectively, p = 0.014). k Changes in membrane potential (∆ψp) in INS-1 832/13 cells superfused with control (DMSO; black) or yoda1 (red trace) as indicated by horizontal lines. ∆ψp expressed as the PMPI fluorescence normalized to the initial value (FPMPI/F0) fluorescence l ΔAUC for changes in ∆ψp induced by addition of yoda1 (red) or solvent (DMSO, black) to superfusion medium for experiments of the type in k (n = 94 and 156 cells for control and yoda1, respectively, all the significant p values are <0.0001). m Recordings of electrical activity of β cells in intact pancreatic islets at 10 mM glucose, before and during application of 50 μM yoda1 (n = 6 cells in different islets). n As in m, but at 3 mM glucose. o The most negative membrane potential (Vmax) of β cells in the presence and absence of 50 μM yoda1 at 3 (n = 6 cells/islets) and 10 mM glucose (n = 3 cells/islets), p values for the comparison between yoda1 treatment under 3 mM G or 10 mM G are 0.0006, 0.0283. p Increase in cell capacitance (ΔCm) measured at various time points after establishment of the whole-cell configuration (t = 0 s) under control conditions and during intracellular application of sucrose with or without inclusion of GsMTx4 as indicated. n = 4, 5, and 5 cells for data control, sucrose and GsMTx4 treatment, respectively. q Net swelling-induced currents (ΔI) recorded during voltage ramps (100 ms) between −100 and +50 mV under control conditions (black; n = 4) and in the presence of 100 mM intracellular sucrose (blue; n = 5) and in the presence of intracellular sucrose and GsMTx4 (red; n = 5). Data are mean values (continuous lines) ± SEM (shaded areas). The swelling-induced current was isolated under each experimental conditions by subtracting currents recorded immediately after establishment of the whole-cell configuration from those observed after 4 min. Data are presented as box Tukey plot in figures d, f, h, j, l, and o. The definition of box Tukey is as indicated as in Fig. 1. Statistical significances were evaluated by one-way ANOVA multiple comparisons in d and h; unpaired Student’s t-test in f, j, and l, one-tailed t-test in o. All statistical tests used were two-sided unless otherwise indicated. *p < 0.05, **p < 0.01, ***p < 0.001, ****p < 0.0001, ns: not significant.

