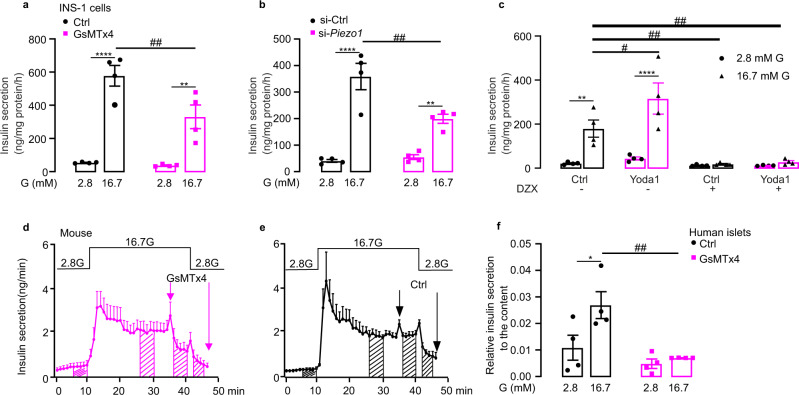
Fig. 5. Piezo1 is required for glucose-stimulated insulin secretion in β cells.
a. Insulin secretion in INS-1 832/13 cells at indicated glucose concentration in the absence (black) or presence (red) of GsMTx4 (2.5 μM) (n = 4), p values for the comparison between 2.8 and 16.7 mM G are <0.0001, 0.0018, p value for the comparison between Ctrl and GsMTx4 under 16.7 mM G is 0.0061. b As in a but in control cells (si-Ctrl) and after silencing of Piezo1 (si-Piezo1) (n = 4), p values for the comparison between 2.8 and 16.7 mM G are <0.0001, 0.0051, p value for the comparison between si-Ctrl and si-Piezo1 under 16.7 mM G is 0.0025. c Insulin secretion in INS-1 832/13 cells at indicated glucose concentration in the presence of DMSO (Ctrl), 25 µM yoda1, 200 µM diazoxide (DZX) or yoda1+DZX (n = 4), p values for the comparison between 2.8 and 16.7 mM G under Ctrl or yoda1 treatment are 0.0028, <0.0001, p values for the comparison between Ctrl and yoda1, Ctrl+DZX, yoda1+DZX under 16.7 mM G are 0.0155, 0.0035, 0.0062, respectively. d The average curve of insulin release measured by in situ pancreas perfusion with GsMTx4 from t=35 min to t=46 min as indicated (GsMTx4; n = 4). e As in d but perfuse without GsMTx4 (Ctrl; n = 3). f As in a but in human islets (n = 4), p value for the comparison between 2.8 and 16.7 mM G in Ctrl is 0.015, that for the comparison between Ctrl and GsMTx4 under 16.7 mM G is 0.0039. Data are presented as dot plots with mean values ± SEM. Statistical significances were evaluated by two-way ANOVA multiple comparisons in a, b, c, f. *, the significance compared between 2.8 mM and 16.7 mM glucose, #, the significance compared between treatments with and without pharmacological drugs. All statistical tests used were two-sided unless otherwise indicated. *p < 0.05, **p < 0.01, ****p < 0.0001, #p <0.05, ##p < 0.01, ns not significant.

