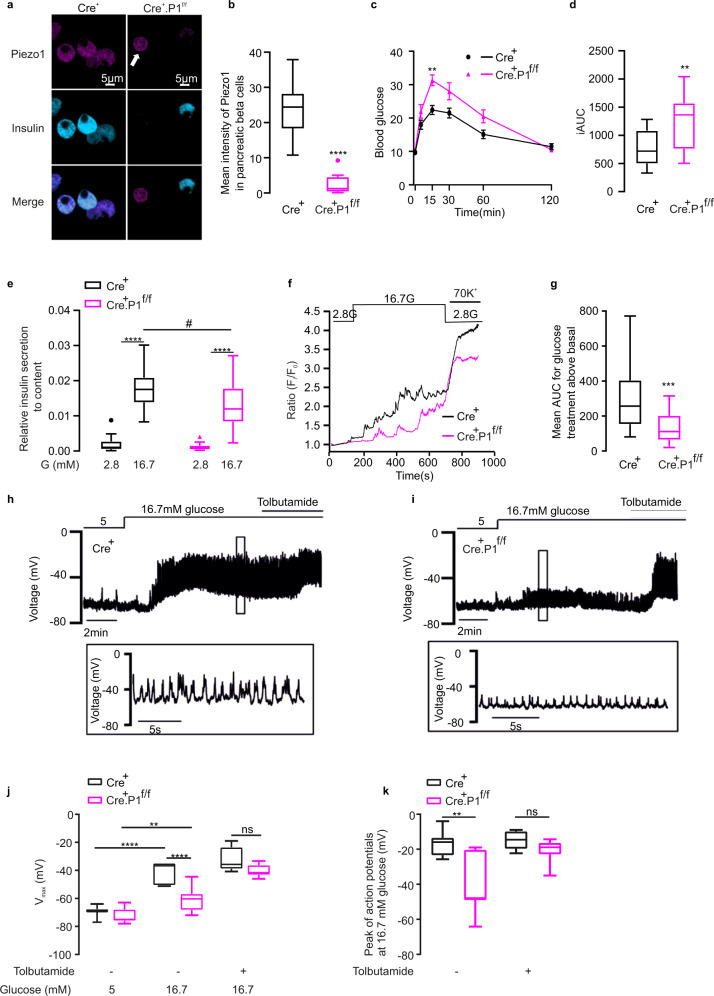
Fig. 6. Impairment of glucose-induced Ca2+ homeostasis in β-cell-specific Piezo1-knockout mice.
a Immunostaining of PIEZO1(violet), Insulin (light blue) in dispersed RIP-Cre+, Cre+.P1f/f mouse islets, white arrow points to the non- β cells. b The mean intensity of PIEZO1 in β cells for a (n = 28, 12 cells for RIP-Cre+, Cre+.P1f/f, respectively, p < 0.0001). c Blood glucose post-IPGTT in male RIP-Cre+ (n = 9, black) or Cre+.P1f/f mice (n = 9, red), p = 0.004. d The average of the incremental area under the curve (iAUC) from 0 to 120 min for c in male RIP-Cre+ (black) or Cre+.P1f/f mice (red) (n = 9 and 9, respectively, p = 0.027). e Insulin secretion in isolated RIP-Cre+ (n = 15, 20 for 2.8 or 16.7 mM G, respectively, black) or Cre+.P1f/f mouse (n = 15, 19 for 2.8 or 16.7 mM G, respectively, red) islets, the results were achieved from 4 mice in each group, p values for the comparison between 2.8 and 16.7 mM G in RIP-Cre+, Cre+.P1f/f mouse were <0.0001, and that for the comparison between RIP-Cre+ and Cre+.P1f/f under 16.7 mM G was 0.013. f [Ca2+]i in RIP-Cre+, Cre+. P1f/f mouse islet cells superfused with medium containing 2.8 or 16.7 mM glucose and following stimulation with 70 mM K+ as indicated. Data expressed as fura-2 fluorescence at each time point normalized to initial value (Fi/F0). g Average of area under the curve (AUC) above basal for 16.7 mM glucose-induced increase in Fi/F0 for experiments in f (n = 33 and 20 for RIP-Cre+, and Cre+.P1f/f, respectively), p = 0.0002. h, i Representative recordings of electrical activity of β cells in intact pancreatic islets from control (Cre+; h and Piezo1-knockout (Cre+.P1f/f; i mice perfused with 5 mM and 16.7 mM glucose (n = 8 for control and n = 10 for knockout islets). Tolbutamide was added to superfusion medium as indicated. j Most negative membrane potential at 5 (n = 8, 10 cells for Cre+, Cre+.P1f/f, respectively, p < 0.0001) and 16.7 mM (n = 8, 10 cells for Cre+, Cre+.P1f/f, respectively, p < 0.0001) glucose and 100 μM tolbutamide (n = 6, 10 cells for Cre+, Cre+.P1f/f, respectively) in control and Piezo1-deficient cells, p value for the comparison between 5 and 16.7 mM G in Cre+.P1f/f mice was 0.0033. k Averaged action potential peak voltage at 16.7 mM glucose and in the presence (n = 6, 10 cells for Cre+, Cre+.P1f/f, respectively) or absence (n = 8, 8 cells for Cre+, Cre+.P1f/f, respectively, p = 0.0001) of tolbutamide as indicated in control and Piezo1-deficient cells. Data are presented as box Tukey plot for figures b, d, e, g, j, and k. The definition of box Tukey is as indicated as in Fig. 1. Statistical significances were evaluated by two-way ANOVA multiple comparisons in c, e, j, and k; unpaired t-test was used in b, d, g. All statistical tests used were two-sided unless otherwise indicated. **p < 0.01, ***p < 0.001, ****p < 0.0001, #p < 0.05.

