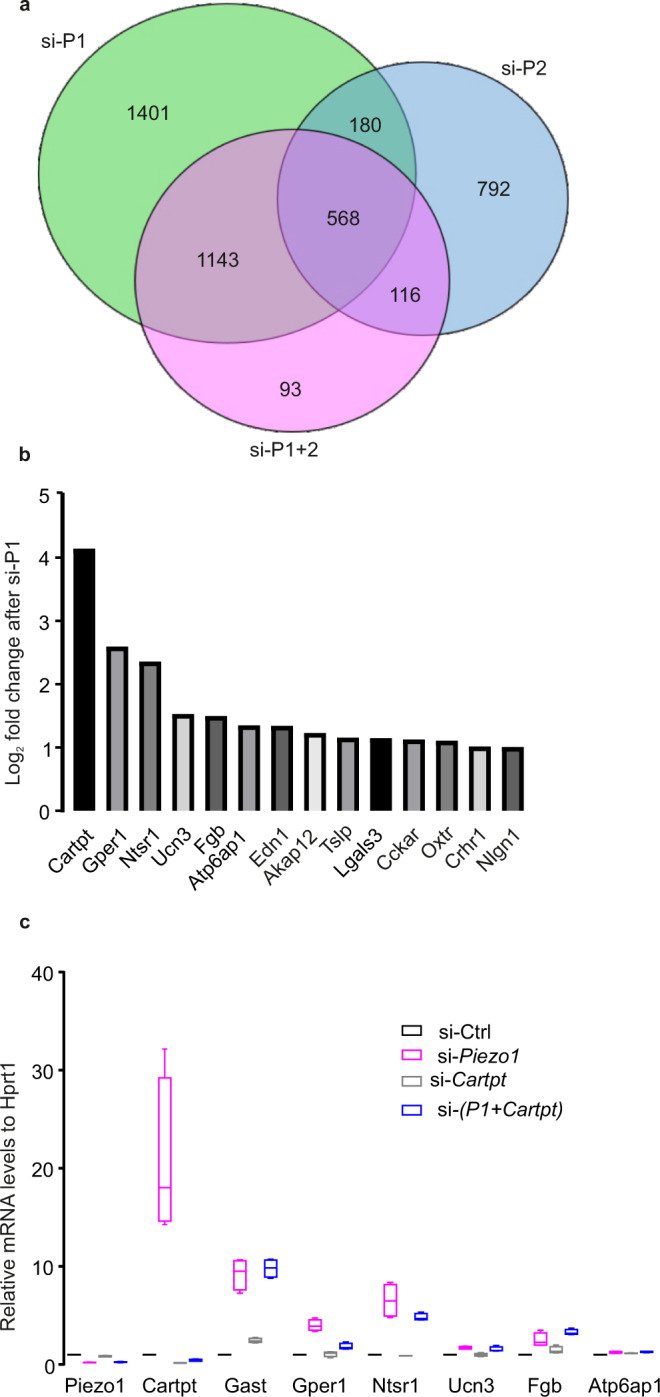
Fig. 7. Piezo1-regulated gene networks.

a Overall differentially expressed genes’ counts after silencing Piezo1 (si-P1), Piezo2 (si-P2), Piezo1 and Piezo2 (si-P1+2). b Log2-fold changes for top 14 genes involved in the GO term- “positive regulation of secretion by cell” compared si-Piezo1 to si-Ctrl. c The relative mRNA expression of the identical top 7 DE genes as in b, from cells of after silencing of Piezo1 (si-Piezo1, n = 4), silencing of Cartpt (si-Cartpt, n = 4), and double silencing of both (si-P1+Cartpt, n = 4). Data are presented as box Tukey plot, and the definition of box Tukey is as indicated as in Fig. 1.
