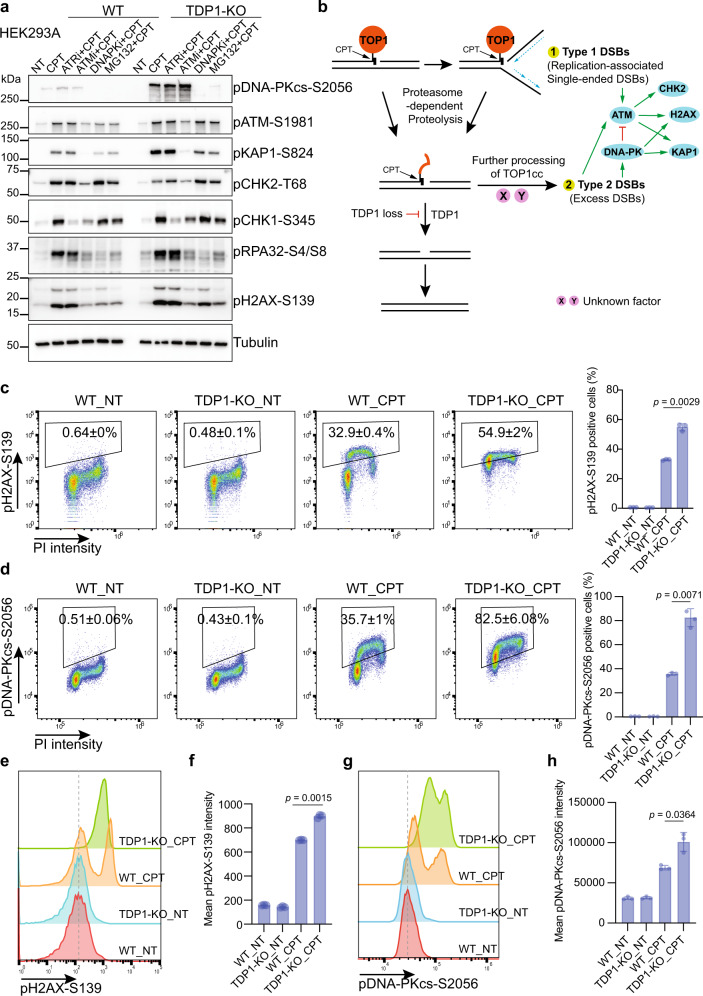
Fig. 2. Proteasome-dependent processing of TOP1cc leads to excess DSB formation in TDP1-KO cells.
a WT and TDP1-KO cells were pre-treated with 10 µM ATRi (AZD6738), 1 µM ATMi (AZD0156), 10 µM DNA-PKi (AZD7648), or 10 µM MG132 for 1 h and then treated with 10 µM CPT for 1 h. Whole-cell extracts were prepared and subjected to Western blotting with the indicated antibodies. Experiments were repeated at least three times, and similar results were obtained. b A model of alternative DNA damage signaling and repair in TDP1-KO cells. c Flow cytometry analysis of pH2AX-S139 and DNA contents (PI staining) in WT and TDP1-KO cells that were either not treated (NT) or treated with 10 µM CPT for 1 h. Gates for pH2AX-S139-positive cells were shown. Numbers are the percentage of pH2AX-S139-positive cells (mean ± SD). Statistical data were also presented as a bar chart (mean ± SD, n = 3 biologically independent experiments). Two-tailed unpaired t test with Welch’s correction was used for statistical analysis. d as in c but pDNA-PKcs-S2056 was analyzed. Statistical data were presented as a bar chart (mean ± SD, n = 3 biologically independent experiments). Two-tailed unpaired t test with Welch’s correction was used for statistical analysis. e A flow cytometry analysis of pH2AX-S139 intensity in WT and TDP1-KO cells that were either not treated (NT) or treated with 10 µM CPT for 1 h. f Quantification of e. Mean pH2AX-S139 intensity were shown in a bar chart (mean ± SD, n = 3 biologically independent experiments). Two-tailed unpaired t test with Welch’s correction was used for statistical analysis. g as in e but pDNA-PKcs-S2056 intensity was analyzed. h Quantification of g. Mean pDNA-PKcs-S2056 intensity was shown in a bar chart (mean ± SD, n = 3 biologically independent experiments). Two-tailed unpaired t test with Welch’s correction was used for statistical analysis.

