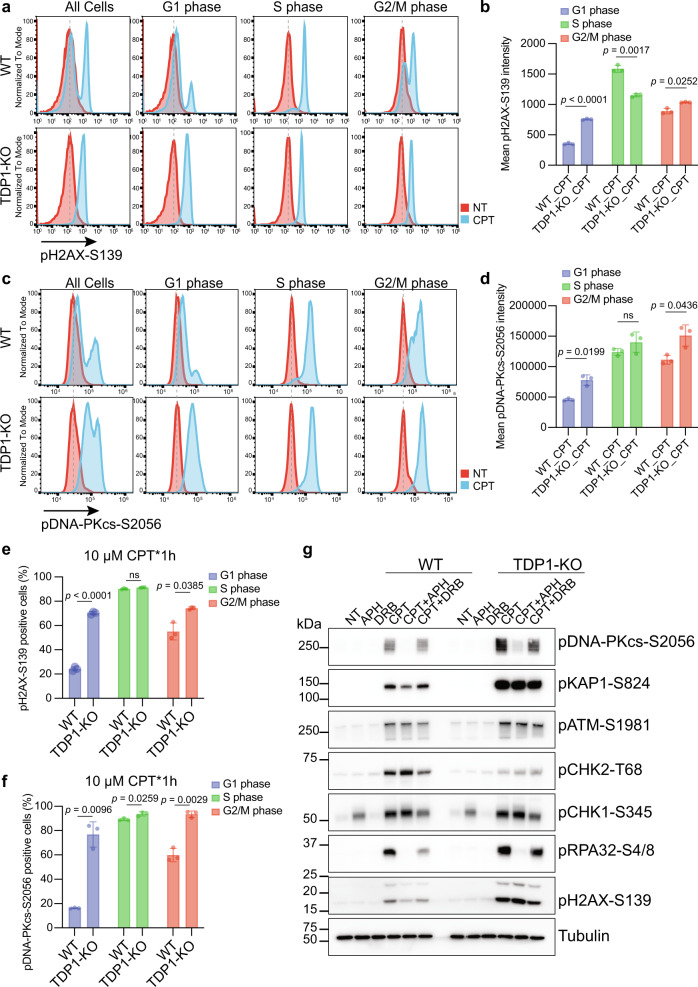
Fig. 3. Excess DSBs formed in TDP1-KO cells after CPT treatment were not cell cycle coordinated.
a Flow cytometry analysis of pH2AX-S139 intensity in WT and TDP1-KO cells either not treated (NT) or treated with 10 µM CPT for 1 h. Cells from G1, S, or G2/M phase were independently presented. b Quantification of a. Mean pH2AX-S139 intensity from three independent experiments are shown in a bar chart (mean ± SD). Two-tailed unpaired t test with Welch’s correction was used for statistical analysis. c Flow cytometry analysis of pDNA-PKcs-S2056 intensity in WT and TDP1-KO cells either NT or treated with 10 µM CPT for 1 h. Cells from G1, S, or G2/M phase were independently presented. d Quantification of c. Mean pDNA-PKcs-S2056 intensity from three independent experiments are shown in a bar chart (mean ± SD). Two-tailed unpaired t test with Welch’s correction was used for statistical analysis. e Percentage of pH2AX-S139-positive cells from three independent experiments are shown in a bar chart (mean ± SD). Two-tailed unpaired t test with Welch’s correction was used for statistical analysis. f Percentage of pDNA-PKcs-S2056-positive cells from three independent experiments are shown in a bar chart (mean ± SD). Two-tailed unpaired t test with Welch’s correction was used for statistical analysis. g WT and TDP1-KO cells were pre-treated with 1 µM APH, or 200 µM DRB for 1 h and then treated with 10 µM CPT for 1 h. Whole-cell extracts were prepared and subjected to Western blotting with the indicated antibodies. Experiments were repeated at least three times, and similar results were obtained.

