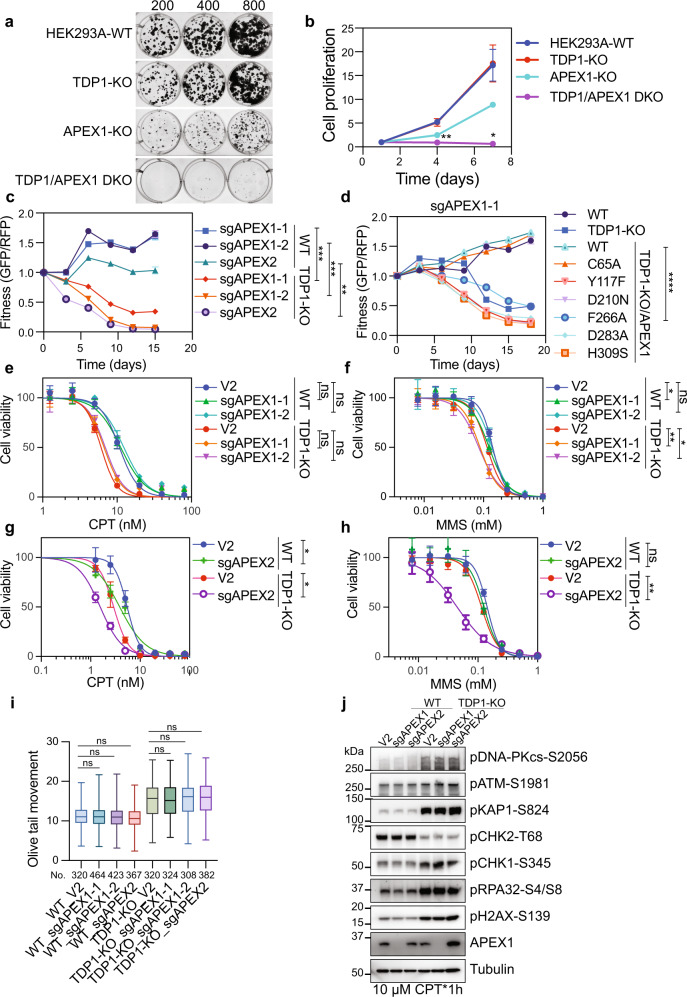
Fig. 5. APEX1 and APEX2 are synthetic lethal with TDP1.
a The relative cell growth rates of indicated cell lines were detected by colony formation assay. b The relative cell growth rates of indicated cell lines were detected by a Cell-Titer Glo assay. Data are represented as mean ± SD (n = 3 biologically independent experiments). Two-tailed unpaired t test with Welch’s correction was used for statistical analysis between TDP1-KO and TDP1/APEX1-DKO. **p (day 4) = 0.0056 and *p (day 7) = 0.0171. c Competitive growth assays in WT and TDP1-KO cells infected with a virus expressing the indicated sgRNAs. Data are presented as mean ± SD (n = 3 biologically independent experiments). Two-tailed unpaired t test with Welch’s correction was used for statistical analysis. ***p (WT_sgAPEX1-1 vs. TDP1-KO_sgAPEX1-1) = 0.0008, ***p (WT_sgAPEX1-2 vs. TDP1-KO_sgAPEX1-2) = 0.0005, and **p (WT_sgAPEX2 vs. TDP1-KO_sgAPEX2) = 0.0012. d Competitive growth assays in cells infected with a virus expressing sgAPEX1-1 in WT, TDP1-KO cells, or TDP1-KO cells overexpressing an sgRNA-resistant wild-type (WT) or mutation APEX1. Data are presented as mean ± SD (n = 3 biologically independent experiments). Two-tailed unpaired t test with Welch’s correction was used for statistical analysis. ****p (TDP1-KO/APEX1-WT vs. TDP1-KO/APEX1-F266) = 0.000058. e, f WT and TDP1-KO cells were infected with pLenti-V2 empty vector or pLenti-V2-sgRNAs targeting APEX1. Cell proliferation was measured using a CellTiter-Glo assay after 3 days in the presence of the indicated concentrations of CPT (e) or MMS (f). Data are presented as the mean ± SD (n = 3 biologically independent experiments). Two-tailed unpaired t-test was used for statistical analysis of the IC50 of each cell line. *p (MMS: WT_V2 vs. WT_sgAPEX1-1) = 0.017755, **p (MMS: TDP1-KO_V2 vs. TDP1-KO_sgAPEX1-1) = 0.004144, *p (MMS: TDP1-KO_V2 vs. TDP1-KO_sgAPEX1-2) = 0.011301, and ns not significant. g, h as in e, f but using an sgRNA targeting APEX2. Two-tailed unpaired t-test was used for statistical analysis of the IC50 of each cell line. *p (CPT: WT_V2 vs. WT_sgAPEX2) = 0.013051, *p (CPT: TDP1-KO_V2 vs. TDP1-KO_sgAPEX2) = 0.021743, **p (MMS: TDP1-KO_V2 vs. TDP1-KO_sgAPEX2) = 0.001097, and ns not significant. i WT and TDP1-KO cells were infected with pLenti-V2 empty vector or pLenti-V2-sgRNAs targeting APEX1 or APEX2. A neutral comet assay was performed after treating cells with 1 µM CPT for 1 h. Olive tail movement was measured by open comet software and plotted as a box plot. The center line indicates the median, the box bounds indicate the first and third quartiles, and the whiskers indicate maximum and minimum. Numbers (No.) of cells examined were indicated. A one-way ANOVA Kruskal–Wallis test was used for statistical analysis. ns, not significant. j WT and TDP1-KO cells were infected with pLenti-V2 empty vector or pLenti-V2-sgRNAs targeting APEX1 or APEX2. Cells were then treated with 10 µM CPT for 1 h. Whole-cell extracts were prepared and subjected to Western blotting with the indicated antibodies. Experiments were repeated at least three times, and similar results were obtained.

