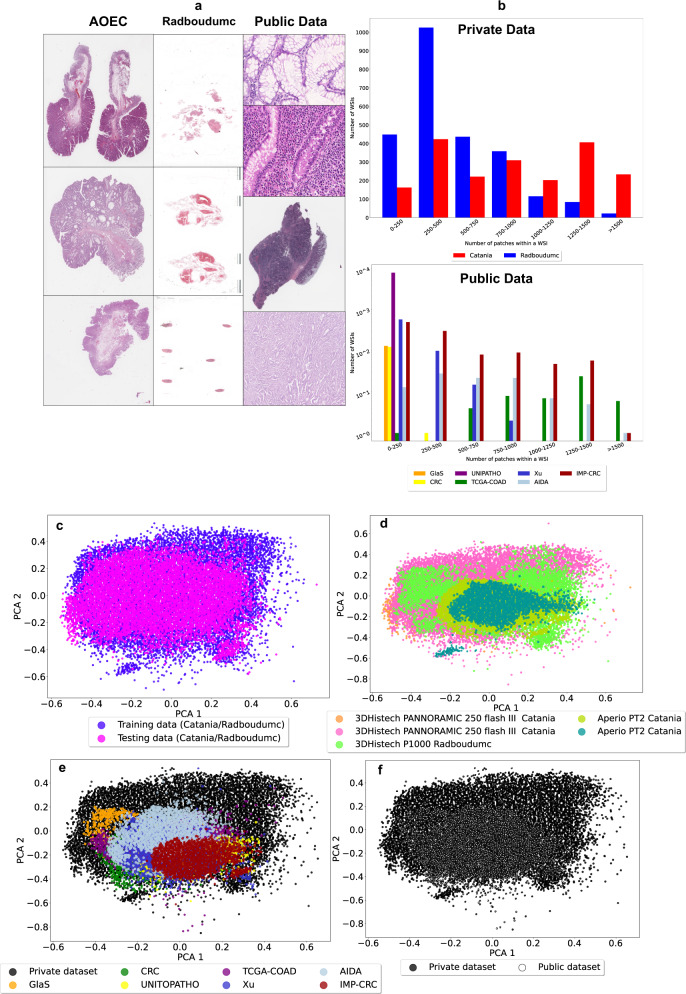
Fig. 5. Overview of data heterogeneity.
a Dataset includes different types of images: Catania partition includes biopsies, colorectal polypectomies and a few tissue resections (larger tissue samples), while Radboudumc includes biopsies and few colorectal polypectomies. b The different kind of image leads to a different number of patches per WSI. The upper histogram includes the number of WSIs as a function of the patches that they include, for Catania (red) and Radboudumc (blue). The fact that tissue resections and colorectal polypectomies are larger tissue samples than biopsies lead Catania to have larger images than Radboudumc. The lower histogram includes the number of images/WSIs as a function of the patches that they include, for GlaS (orange), CRC Dataset (yellow), UNITOPATHO (purple), TCGA-COAD (green), Xu dataset (light blue) and AIDA (celestial). c WSIs are scanned with several scanners, leading to heterogeneity in terms of colour. The heterogeneity is evaluated by analyzing the H&E matrices distributions, projected in two dimensions with Principal Component Analysis (PCA). The H&E matrix distributions for patches from training (purple) and testing (magenta) partitions in Catania and Radboudumc data. d The H&E matrix distributions for patches from pathology workflow, from APERIO PT2 (Catania, lime), APERIO PT2 (Catania, sky blue), 3DHistech PANNORAMIC 250 Flash III (Catania, pink), 3DHistech P1000 (Radboudumc, green). e The H&E matrix distributions for patches from private pathology workflow (black) and publicly available datasets (white). f The H&E matrix distributions for patches from GlaS (orange), CRC Dataset (yellow), UNITOPATHO (purple), TCGA-COAD (green), Xu dataset (light blue), AIDA (celestial) and pathology workflow (black).

