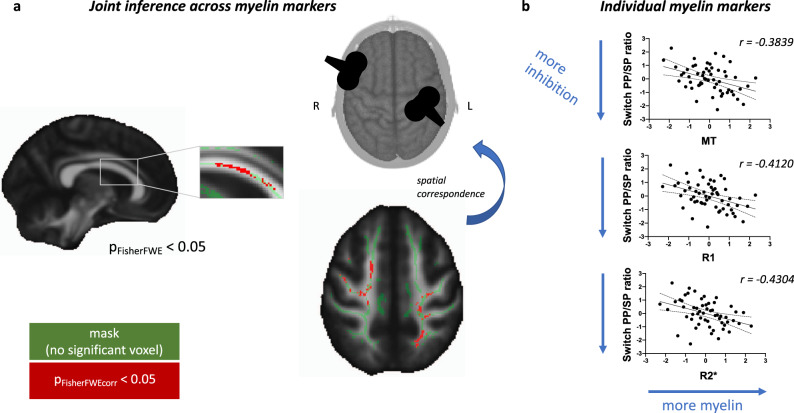
Fig. 2. Multimodal joint inference reveals concordant relationships between interhemispheric cortico-cortical inhibition and myelin markers across modalities.
a Result of joint inference across myelin markers. Clusters of significant voxels are shown in red (peak pFisherFWE = 0.016), overlaid on the white matter skeleton (green). Significance threshold for joint inference Fisher test is set at 0.05 after correcting for family-wise error correction. b Correlations between switch PP/SP ratio (paired pulse/single pulse ratio from ppTMS) and individual myelin markers. Each data point is a single participant; scatterplots and Spearman correlation effect sizes are presented for post hoc visualisation of the correlations, rather than for statistical inference.

