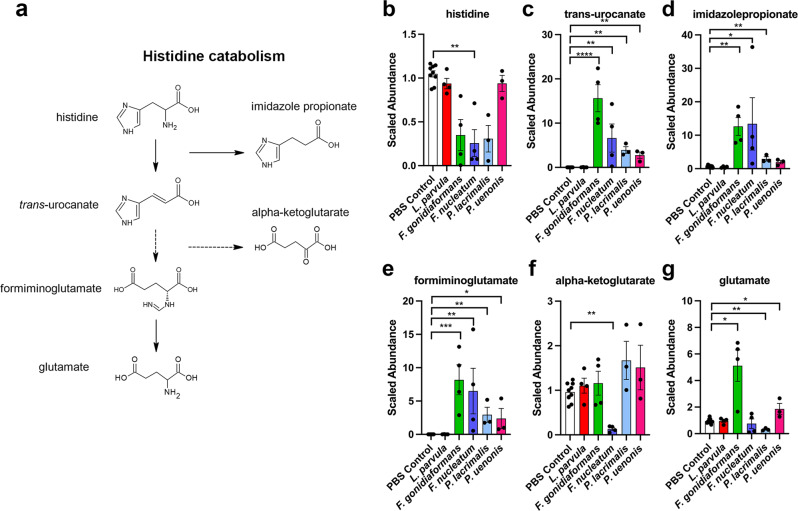
Fig. 6. BVAB modulates metabolic profiles corresponding to histidine degradation.
a Select metabolites of the histidine degradation pathway (KEGG, M00045) corresponding to significantly accumulated or depleted metabolites in the graphs on the right. Graphs represent scaled metabolite abundances of b histidine, c trans-urocanate, d imidazole propionate, e formiminoglutmate, f alpha-ketoglutarate, and g glutamate. *p < 0.05; **p < 0.01; ***p < 0.001; ****p < 0.0001. Two-tailed paired Student’s t-tests (infection vs. mock-infected controls). Box and whiskers bars show median and error bars represent standard error. A minimum of n = 3 independent replicates were performed and measured for each condition.

