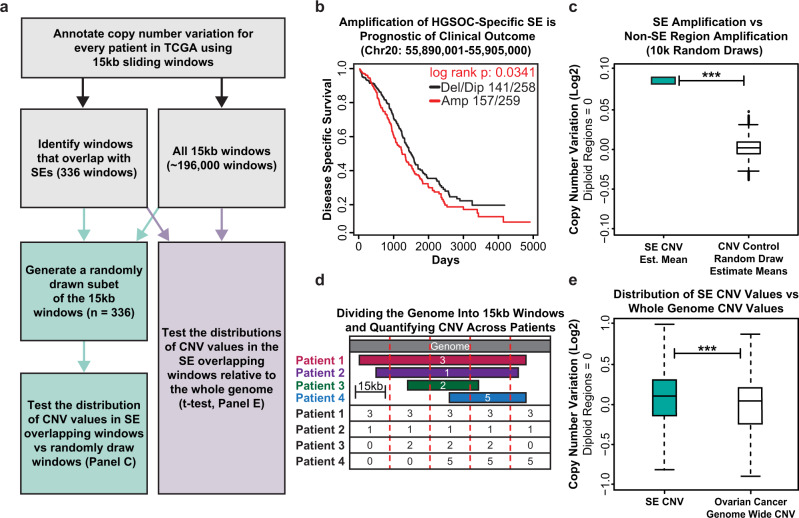
Fig. 2. BRD4 bound super-enhancers are enriched for copy number alterations in ovarian cancer patients.
a Flowchart of the analysis strategy used to quantify the relationship between SEs defined in OVCAR3 cells and copy number alterations in high-grade serous ovarian cancer patients. b Copy number Kaplan–Meier plot for a 15 kb window that overlaps an OVCAR3 defined SE at Chr20:55,890,001–55,905,000. The red line represents HGSOC patients with copy number amplification of this region above the median, the black line represents patients with copy number below the median. c Summary plot showing the results of 10,000 comparisons between the copy number amplifications at SE overlapping windows versus 10,000 randomly drawn subsets of the genomic background. Asterisks represent significant differences as determined by a one-sided t-test and validated with a Mann–Whitney-U non-parametric comparison. n = 1 (left), n = 10,000 (right) with all samples being independent. d Cartoon showing the computational approach used to divide the genome into 15 kb windows and assign patient-specific copy number values to each window by overlap analysis. e Box plot showing the comparison of copy number amplification across the SE overlapping windows (n = 336) versus all 15 kb windows across the ovarian cancer genome (n = ~192,000). Asterisks represent significant differences as determined by a one-sided t-test and validated with a Mann–Whitney-U non-parametric comparison. ***p-value < 2.2E−16. Box plots in c and e are centered on the median (center line), with the upper and lower quartiles creating the bounds of the box (the IQR). The minimum and maximum values, after disregarding outliers, are represented by the upper and lower whiskers. Source data are provided as a Source Data file.

