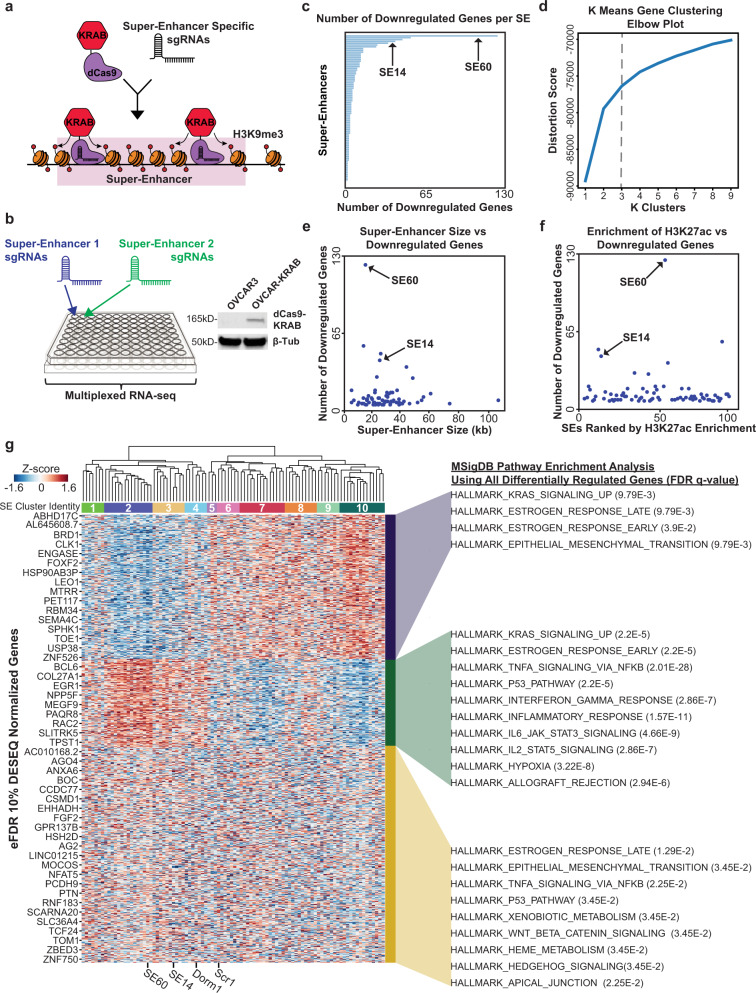
Fig. 3. Systematic epigenetic silencing of ovarian cancer enriched super-enhancers using CRISPRi (dCas9-KRAB) coupled to multiplexed RNA-seq.
a Cartoon showing sgRNA-guided dCas9-KRAB epigenetic silencing of a SE via enrichment of the repressive histone modification H3K9me3. b Experimental setup for the CRISPRi screen in a 96-well plate (left). Western blot showing OVCAR3 cells engineered to stably express dCas9-KRAB (right). Results are representative of 3 independent experiments. dCas9-KRAB expressing OVCAR3 cells were plated in each well. One SE was targeted per well (86 SEs plus 10 control wells). After 72 h of enhancer silencing, changes in gene expression were measured using barcoded RNA-seq. Two sgRNAs were custom designed for each SE and transfected into each corresponding well. c Horizontal bar chart showing the number of downregulated genes for each SE. SE60 and SE14 were selected for further analysis as described in the text and are indicated by arrows. d K means clustering elbow plot used to determine the optimal number of gene clusters across significant DEGs for all SEs pulled from the screen analysis. The “elbow” determines the ideal cluster number which was chosen as 3. e Scatterplot comparing SE size versus the number of downregulated genes. There is no correlation between SE size and the number of target genes. SE60 and SE14 were selected for further analysis as described in the text and are indicated by arrows. f Scatterplot comparing H3K27ac enrichment versus the number of downregulated genes. There is not a strong correlation between H3K27ac enrichment and the number of target genes. g Heatmap representing the unsupervised hierarchical clustering of all SEs (clusters 1–10 under the dendrogram) and controls in the screen across all screen DEGs (left). The boxes on the right denote the three K-means clusters. MSigDB pathway analysis describes the functions the genes in these clusters are involved in (right). SE60, SE14, and the two negative controls are denoted at the bottom of the plot. Source data are provided as a Source Data file.

