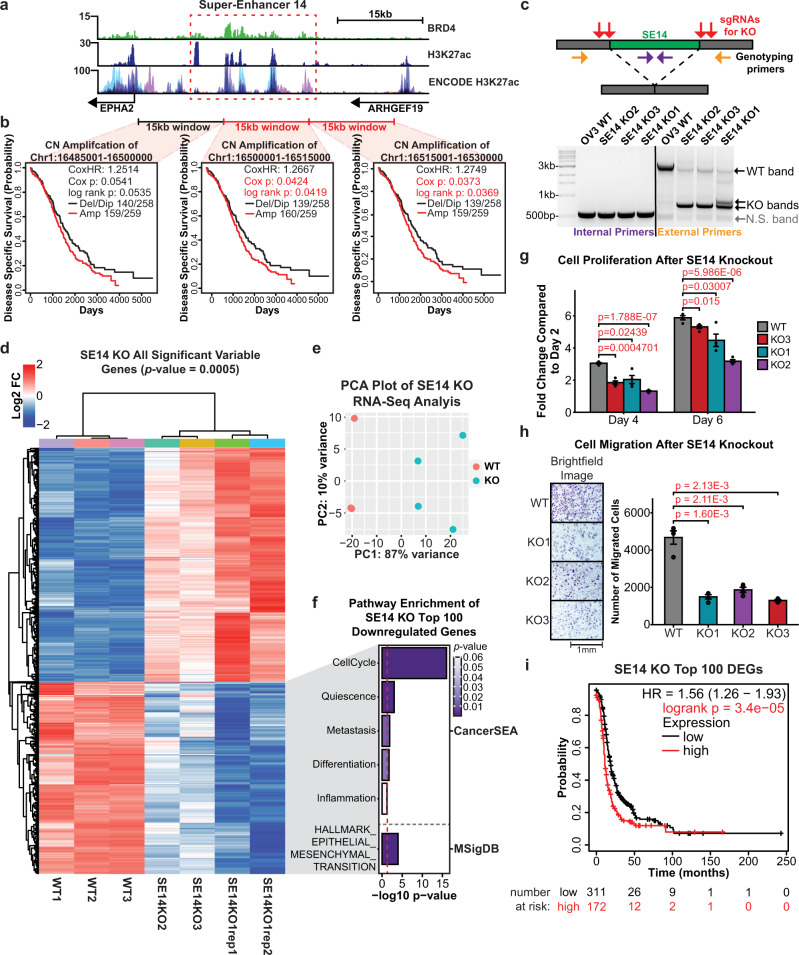
Fig. 5. CRISPR-knockout of super-enhancer 14 leads to profound changes in gene expression and reduced proliferation of cancer cells.
a Genome browser view of SE14 (dashed red box) and the surrounding region showing enrichment of BRD4, H3K27ac, and ENCODE H3K27ac signal. b Kaplan–Meier plots of copy number amplification over each SE14 overlapping 15 kb windows versus disease-specific survival in TCGA HGSOC patients. Significance was assessed using a log-rank test and Cox proportional hazards model. c Top: Cartoon showing CRISPR-based deletion of SE14. Bottom: Genotyping PCR showing successful heterozygous knockouts of SE14—representative of three independent experiments. d Unsupervised hierarchical clustering heatmap of all 1750 significant DEGs (Pearson Correlation, adjusted p-value > 0.0005 at any fold change) between wild-type and SE14 KO cells measured by RNA-seq. e PCA plot showing the variance landscape of WT and KO samples. f Pathway analysis using CancerSEA and MSigDB of the 100 most significant DEGs detected (as determined by Kolmogorov–Smirnov style GSVA followed by Spearman’s rank test with BH FDR correction). The red line denotes the metric for a p-value of 0.05 converted into the −log10 scale. g Proliferation assays of three independent SE14 KO clones versus wild-type OVCAR3 cells. Results are shown as fold change compared to day 2 values. The statistically significant differences (as determined by a two-sided Student’s t-test) are provided in red text. n = 4 biological replicates. Data are shown as mean ± SEM. h Cell migration assays of three independent SE14 KO clones versus wild-type OVCAR3 cells. Microscope brightfield images of the growth after 24 h (left). Bar chart representation of cell count after 24 h, statistically significant differences (as determined by a two-sided Student’s t-test) are provided in red text (right). n = 4 biological replicates. Data are shown as mean ± SEM. i Kaplan–Meier plot34,35 showing the clinical significance of the top 100 downregulated genes after SE60 KO. Significant p-values are denoted in red text. Source data are provided as a Source Data file.

