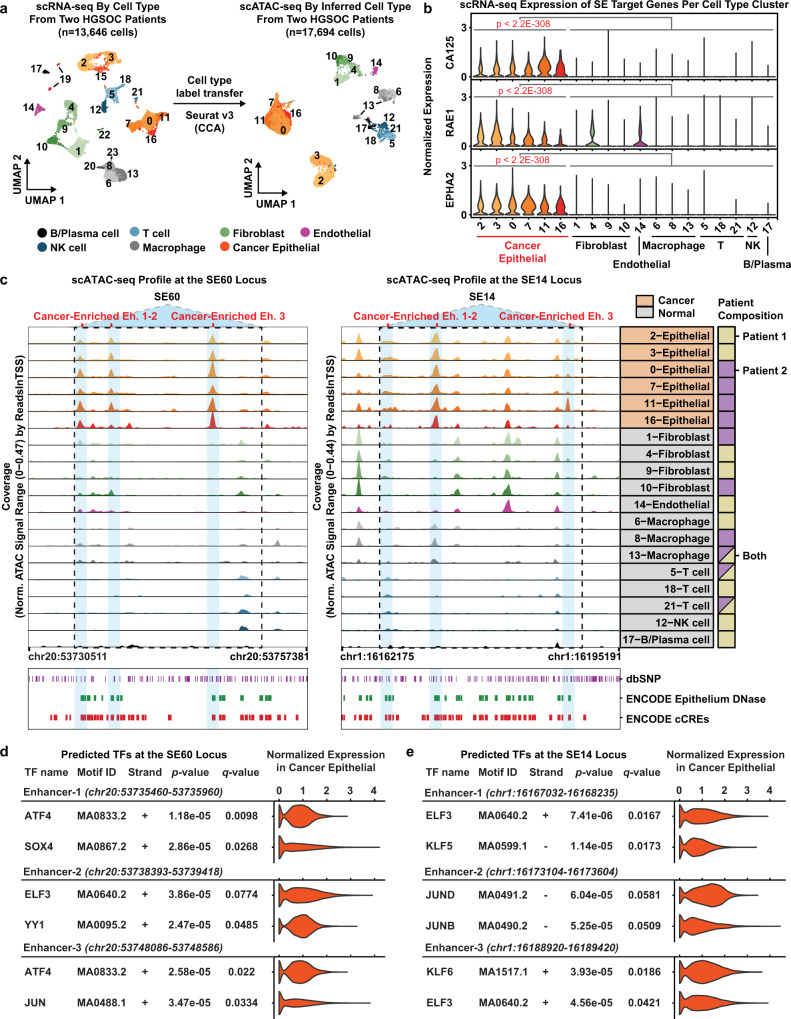
Fig. 7. Super-enhancer 60, 14, and their direct target genes are enriched in malignant cells of HGSOC patient tumors as determined by scRNA-seq and matched scATAC-seq.
a UMAP plot of 13,646 scRNA-seq cells colored by cell type from two HGSOC patients (left). UMAP plot of 17,694 scATAC-seq cells from the same patients colored by cell type (right). Cluster numbers in each UMAP plot denote cell-type clusters. b Violin plots showing the distribution of gene expression values from scRNA-seq in each cell type cluster for CA125, RAE1, and EPHA2. Columns represent a cell-type cluster. Genes have a statistically significant difference in expression between the cancer and non-cancer cell type clusters (Wilcoxon Rank Sum tests, Bonferroni-corrected p-values < 2.2e−308 & average logFC ≥ 0.1). c scATAC-seq browser track showing chromatin accessibility profiles at the SE60 locus (left) and SE14 locus (right) for each cell type cluster. Blue shadows denote cancer-enriched constituent enhancers. Each blue region has a statistically significant difference in accessibility between cancer and non-cancer cell type clusters (Wilcoxon Rank Sum tests, Benjamini–Hochberg FDR ≤ 0.10 and Log2FC ≥ 0.25). Cancer status is denoted in orange for each row label. Patient composition is denoted by a solid square if from one patient, or a split colored square if otherwise (far right). Bottom—annotated dbSNPs, Epithelium DNase hypersensitivity sites in normal epithelium, and ENCODE regulatory elements (ccREs). d Summary of FIMO TF motif occurrences within SE60 cancer enriched enhancers 1–3. Matching scRNA-seq TF expression in the cancer epithelial fraction is shown in the violin plot for each motif. Statistically significant motif matches identified by FIMO were defined as a Benjamini–Hochberg corrected p-value (i.e., q value) < 0.10. e Summary of FIMO TF motif occurrences within SE14 cancer enriched enhancers 1–3. Matching scRNA-seq TF expression in the cancer epithelial fraction is shown in the violin plot for each motif. Statistically significant motif matches identified by FIMO were defined as a Benjamini–Hochberg corrected p-value (i.e., q value) < 0.10. Source data are provided as a Source Data file.

