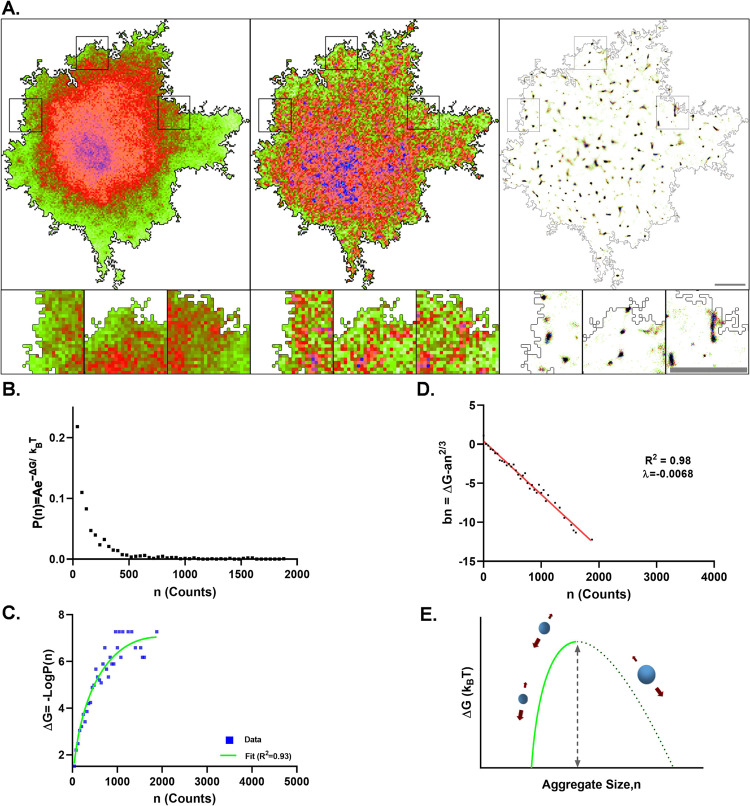
Fig. 1. Nanoscale lateral organization of SAP97/hDLG follows a first-order phase transition in Neuro-2a cells.
A Conventional epifluorescence microscopy, Total internal reflection (TIRF) microscopy and direct stochastic optical reconstruction microscopy (dSTORM) images of SAP97/hDLG in Neuro-2a cell showing the sub-diffracted population of clusters. B A plot of the probability distribution function of single molecules detected inside the nanoclusters. C The curve fit of the inverse of probability distribution of molecules according to the function an2/3 – bn + c to obtain the parameters a, b, and c, which define the nucleation barrier (∆Gc) and critical cluster radius (Rc). D Linear regression plot of the resultant surface energy correction by subtracting the surface energy (an2/3) from the –LogP(n) data. The negative linear slope indicates the second term b, which corresponds to an increase in entropy. E Schematic of the free energy function, which follows a first-order phase transition. The broad arrows represent the favored direction of aggregate size with respect to spontaneous growth or diffusion of aggregates. The solid line represents the extent of experimental values. The critical cluster size and nucleation barrier height were calculated from the curve fit. N = 1297 clusters from 9 cells. Cumulative data from three experiments. All cells were fixed before imaging. Log refers to the natural logarithm to base “e”. Scalebar indicates 4 µm.

