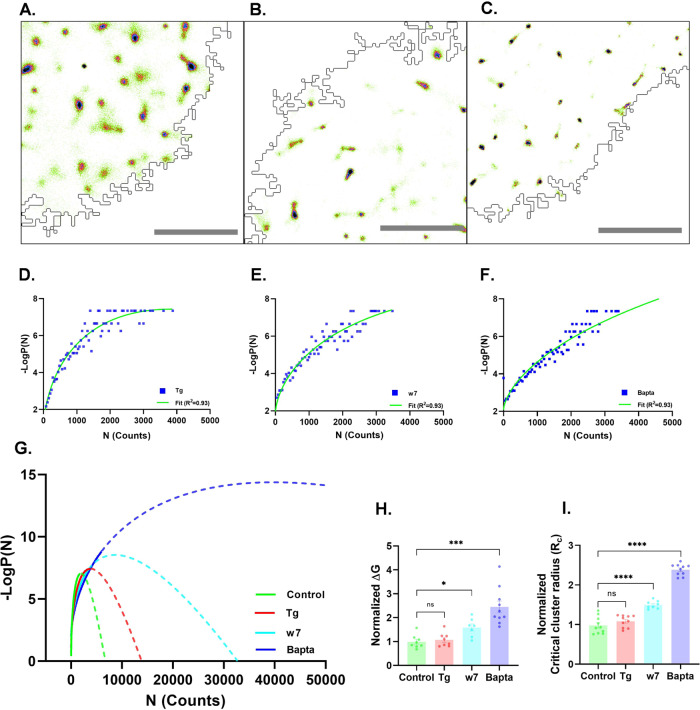
Fig. 2. Intracellular Ca2+ levels can regulate the super-saturation of SAP97/hDLG nanoclusters.
Reconstructed super resolved images (500 × 500 pixels) of SAP97/hDLG in Neuro-2a cells treated with A Thapsigargin (Tg), B w7, C Bapta, and D–F their –Log((n)) vs. n curve, from each condition. G The functional fit of –Log(P(n)) from different pharmacological treatments. H The normalized free energy barrier for each condition, calculated from the functional fit, is plotted and compared with control. I The plot represents the normalized critical cluster radius (nm) during different treatments, compared to control data. The data is from 1000–1500 clusters (N = 10 cells (Control, Tg and Bapta), 8 cells (w7)) in each condition cumulated from three experiments. Statistical test for ∆Gc and Rc was performed by one-way ANOVA. Log refers to the natural logarithm to base “e”. Data are presented as mean values ± SEM. *p < 0.05, ****p < 0.0001 (Supplementary Table 1). Scalebar = 4 µm. Source data are provided as Source Data file.

