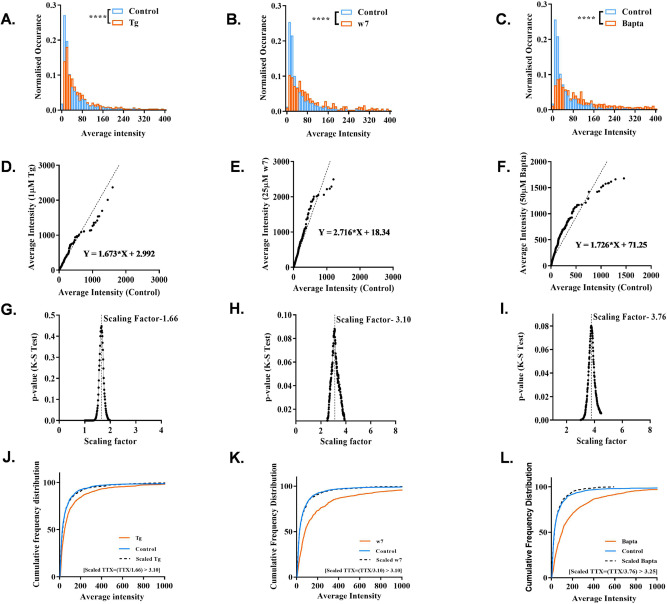
Fig. 3. Scaling of endogenous SAP97 clusters using rank-order analysis.
A–C The histogram was plotted for the average intensity of SAP97/hDLG clusters between control and all treated conditions. A Thapsigargin (1 μM), B w7 (25 μM), and C Bapta (50 μM). N = 10 cells for control and treated datasets. D–F A total of 1000 cluster datapoints of average intensity were chosen randomly from each dataset, rank-ordered, and plotted to provide a linear regression for each condition. The slope of regression depicts an arbitrary scaling factor. G–I The analysis provided a scaling factor with a maximum p-value between control and scaled-treated datasets. The p-values for Tg (D), w7 (E), and Bapta (F) were p = 0.44, p = 0.09, and p = 0.08, respectively. A total of 800–1000 random average intensity datapoints were chosen from each dataset, rank-ordered, and plotted to provide a linear equation for each treatment. J–L A cumulative frequency distribution was plotted for control, treated, and scaled-treated conditions of SAP97/hDLG in Neuro-2a cells. The datasets were analyzed for a significant change in mean values by two-tailed K–S test, *p < 0.05, **p < 0.01, ****p < 0.0001 (Supplementary Table 2).

