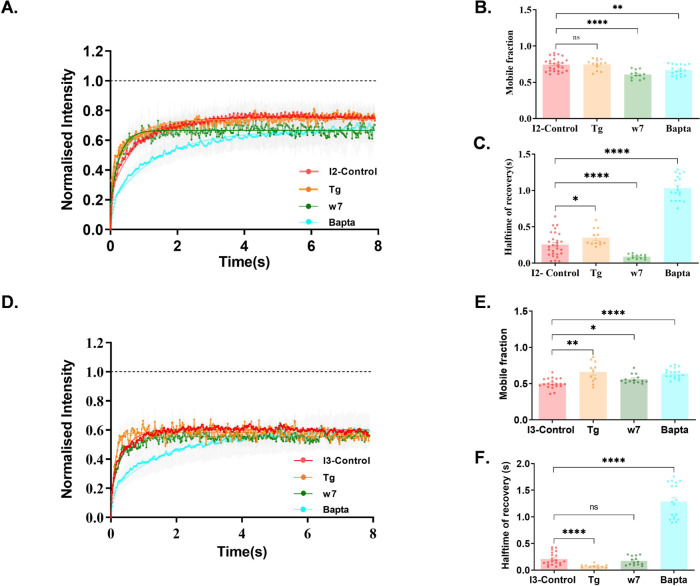
Fig. 4. Differential dynamics of hDLG::GFP variants upon modulating cytosolic Ca2+ in Neuro-2a cells.
Cells expressing I2-hDLG::GFP (A–C) and I3-hDLG::GFP (D–F) were treated with Tg, w7, and Bapta (A, D). The recovery of fluorescence intensity against time is plotted for different conditions. Curve fitting was done using a single-phase exponential growth curve. B, C, E, F The mobile fraction and halftime of recovery were recovered from the respective curves and tested by one-way ANOVA. N = 13 cells; 26 ROI (Control), 8 cells; 13 ROI (Tg), 8 cells; 12 ROI (w7), and 9 cells; 18 ROI. The data was cumulated from three experiments. Data are presented as mean values ± SEM. *p < 0.05, **p < 0.01, ****p < 0.0001 (Supplementary Table 3). Source data are provided as Source Data file.

