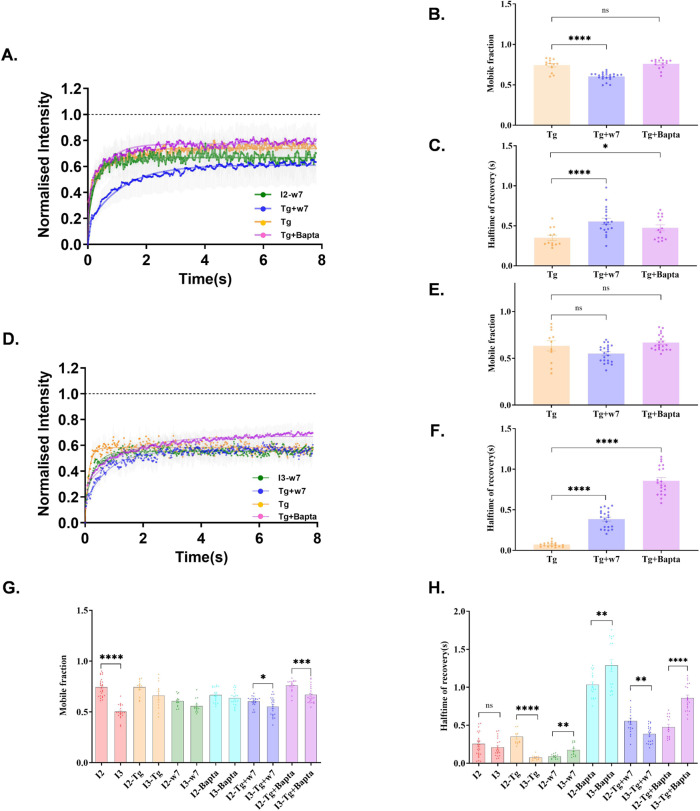
Fig. 5. Effect of Calmodulin and cytosolic Ca2+ levels on hDLG::GFP variants.
The recovery of fluorescence intensity in cells expressing I2-hDLG::GFP (A) and I3-hDLG::GFP (D) treated with w7, Tg, w7 + Tg, and Tg + Bapta fit by a single-phase exponential growth curve. N = 8 cells; ROI = 13 (Tg), 10 cells; ROI = 22 (Tg + w7), 9 cells; ROI = 15. The data is cumulated from three experiments. The data was statistically tested using a two-tailed unpaired t-test with Welch’s correction. *p < 0.05, **p < 0.01, ****p < 0.0001 (Supplementary Table 4). The mobile fraction and halftime of recovery of I2 (B, C) and I3 (E, F) were extracted from the analysis of the respective curves. Mobile fraction (G) and halftime of recovery (H) of all conditions between I2-hDLG::GFP and I3-hDLG::GFP expressing cells were analyzed using a two-tailed unpaired t-test with Welch’s correction. Data are presented as mean values ± SEM. *p < 0.05, **p < 0.01, ****p < 0.0001 (Supplementary Tables 4 and 5). Source data are provided as Source Data file.

