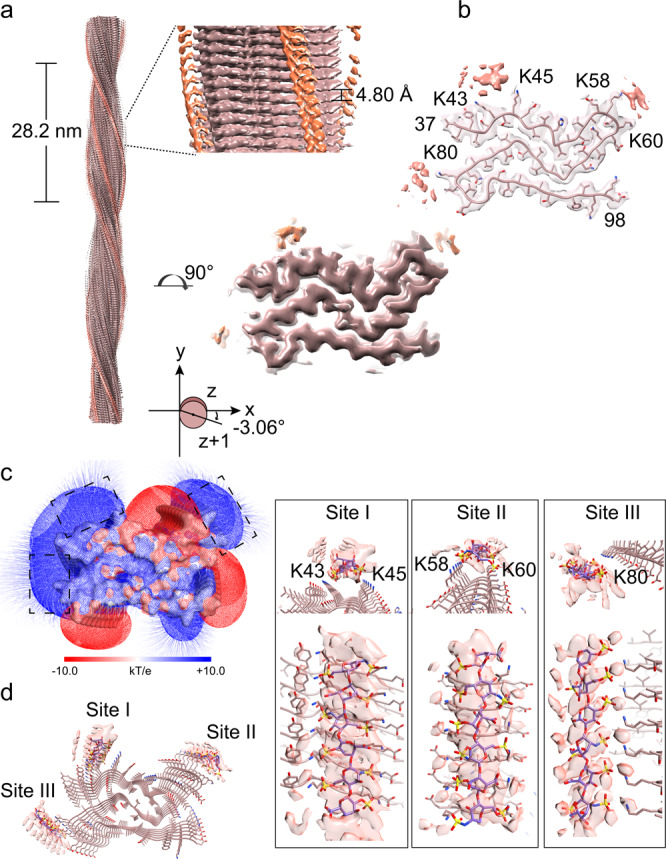
Fig. 4. Cryo-EM structure of the Hep-P4 fibril.

a Cryo-EM density map of the Hep-P4 fibril. The fibril parameters including the length of half pitch (180° helical turn), helical rise and twist angle are indicated. Extra densities are displayed with the same threshold (0.0095) as protein densities. Extra densities for heparin are colored in orange in the density map. No specified radius was used to plot around residues/heparin. b Cross-section view of the structural model fitted in the density map. The density map is the same map in (a) but restricted to areas within a 2 Å radius of the α-syn model, and then combined with the heparin densities in (a). c Cross-section view of the electrostatic potential surface of the Hep-P1 fibril. The heparin-binding sites are highlighted dash boxes. A surface potential color bar is shown. d Molecular docking of heparin into the extra densities. Heparin molecules are shown in sticks and colored in purple). Cross-section view is shown on the left. Side view is shown in boxes on the right.
