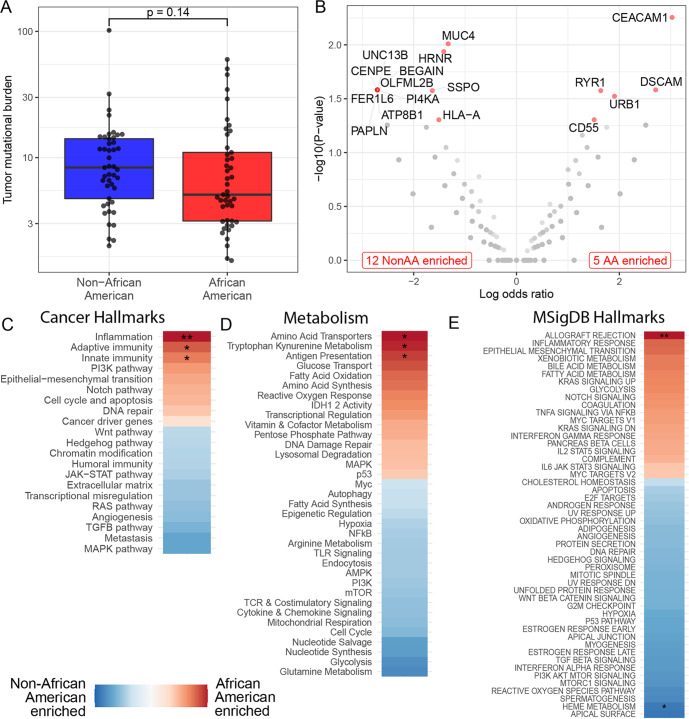
Fig. 1. Genes and pathways affected by somatic mutations in Non-African American (NonAA) and African American (AA) TNBC patients.
A Tumor mutation burden with median (center line) and standard deviation. B Volcano plot of differentially mutated genes. Genes with significantly different mutation frequencies are labeled and marked red. C–E Differential enrichment of mutations in pathways. Color coding shows the directionality of enrichment. Stars indicate significantly differentially affected pathways (*p < 0.05, **p < 0.01, ***p < 0.001; Mann–Whitney Test, Wald Test, Permutation Test).

