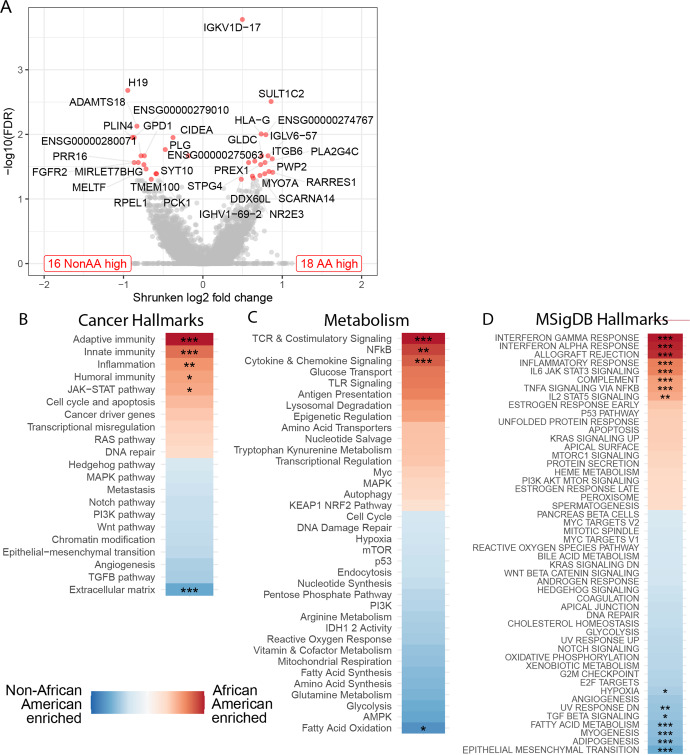
Fig. 2. Differentially expressed genes and pathways in Non-African American (NonAA) and African American (AA) TNBC patients.
A Volcano plot of differentially expressed genes (FDR < 0.05 and |log2 fold change | > 1 | )) are labeled and marked red. The number of up-regulated genes are shown in bottom corners. B–D Gene set enrichment analysis of Nanostring hallmarks of cancer gene set (B), Nanostring metabolic pathways (C), and hallmark pathways from MSigDB database (D). Color coding shows the directionality of enrichment. Stars indicate significant results (*adjusted p < 0.05, **adjusted p < 0.01, ***adjusted p < 0.001; Wald Test, Permutation Test).

