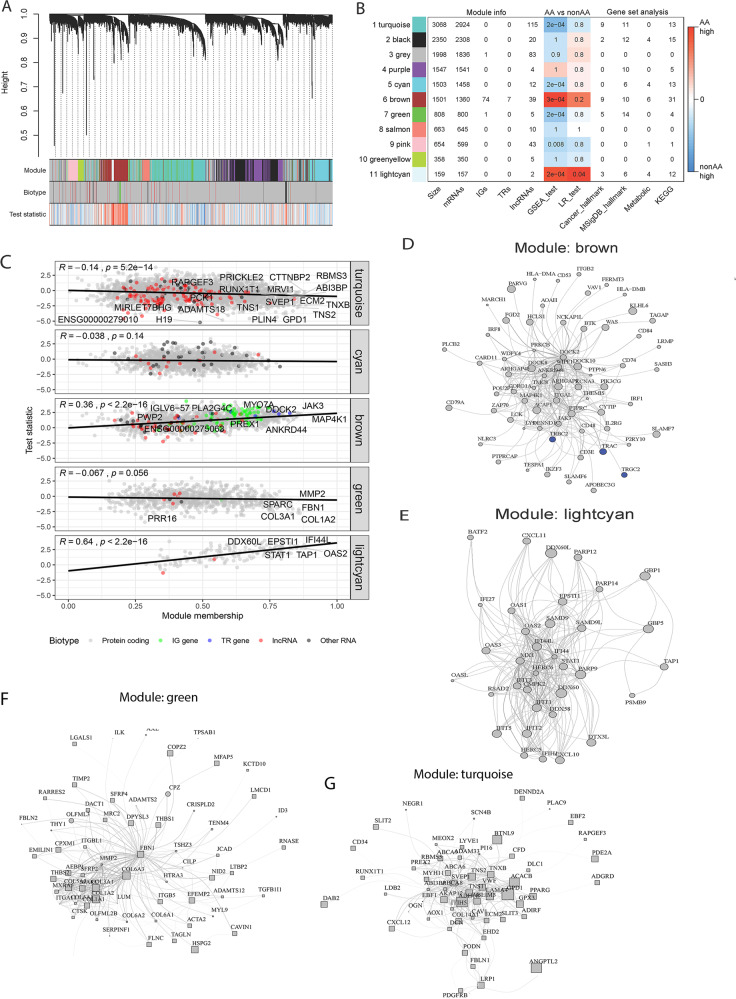
Fig. 3. Gene co-expression network analysis.
A Cluster dendrogram highlighting searching for gene co-expression modules. Final 11 modules are colored turquoise, black, gray, purple, cyan, brown, green, salmon, pink, greenyellow, and lightcyan. Biotype denote protein-coding genes, IG genes, TR genes, lncRNAs, or other RNAs. Test statistic is from differential analysis using DESeq package. B Modules description. First four columns show the module size and the number of genes categorized by biotype. Next two columns show p-values from statistical test comparing expression in NonAA vs AA patients. Last four columns show the number of enriched pathways in gene set analysis. C Association between module membership (correlation with module eigenvalue) and test statistic from DESEq2. Hub genes are those with highest value of module membership. D–G Topology layouts of highest module membership genes in each module. Nodes are colored by biotype. Size of the nodes is proportional to DESEq2 test statistic. Node shapes represent directionality of expression change (circle means higher expression in AA, while square means higher expression in NonAA cohort).

