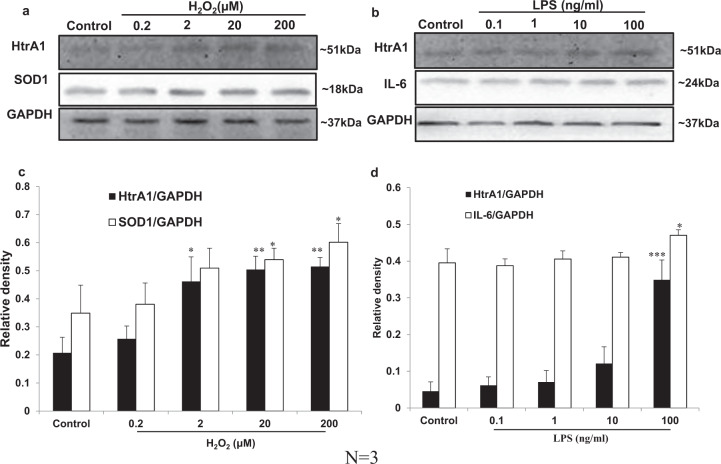
Fig. 1. Western blot analysis of HtrA1 expression in ARPE-19 cells treated with H2O2 or LPS.
Serum-starved ARPE-19 cells were plated on dishes in medium supplemented with varying concentrations of H2O2 (a) or LPS (b) for 24 h and then lysed. The lysates were analysed by western blot. The control was performed with vehicle. Blots were developed with HRP-conjugated secondary antibodies and an enhanced chemiluminescence detection kit. c, d Densitometry of three independent experiments. The western blot gels were cropped according to the molecular size of protein. Band density (grey value) was analysed using Quantity One software and used to determine the relative protein level. Results were expressed as means ± SD (n = 3). *p < 0.05, **p < 0.01, ***p < 0.001, compared with control.

