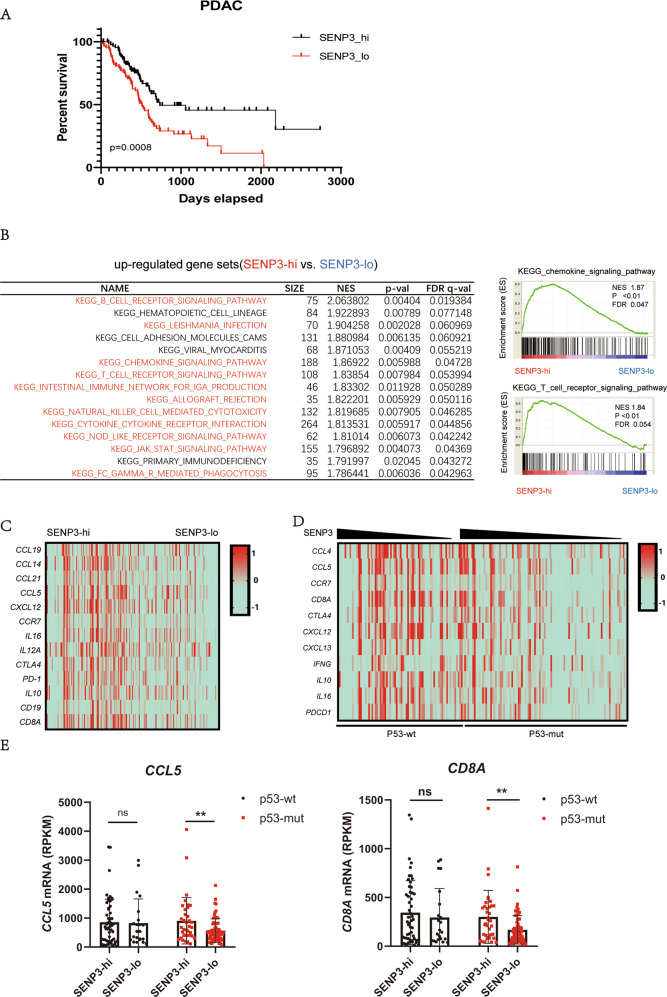
Fig. 5. SENP3 expression positively correlated with immune response in p53 mutant pancreatic cancer patients [40].
A Kaplan–Meier curves of human PDAC patients with SENP3 high or low. B Gene Sets Enrichment Assay (GSEA) is used to analyze RNA sequence data of PDAC patients from TCGA database. The list shows the top pathways upregulated in SENP3 high vs. SENP3 low and shows that chemokine signaling and TCR signaling-related genes were enriched in SENP3 high patients. C Heatmaps show that immune response-related genes are positively related to SENP3 expression level in PDAC patients from TCGA database. D Heatmaps show that immune response-related genes are a positive correlation with SENP3 expression levels in p53 mutant PDAC patients from TCGA database. E The high mRNA level of CCL5 and CD8A is shown in SENP3 high PDAC patients with p53 mutant but not the patients with p53 wild type.

