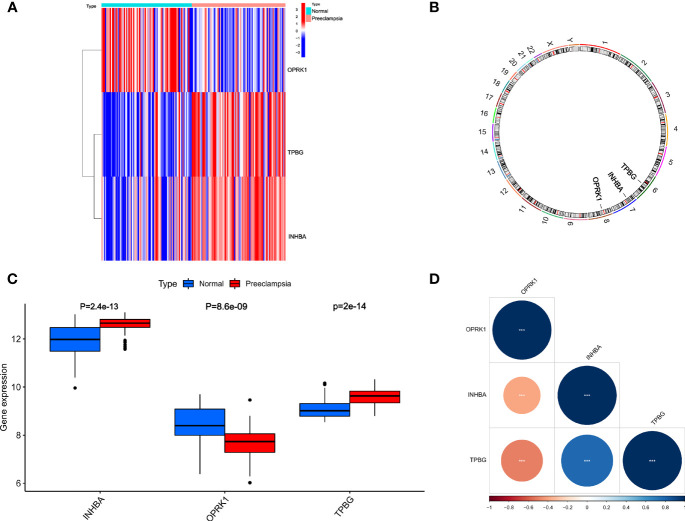
Figure 5.
Relative expression level and correlation among INHBA, OPRK1 and TPBG. (A) The heatmap of INHBA, OPRK1 and TPBG between PE group and non-PE group. (B) The chromosomal locations of INHBA, OPRK1 and TPBG. (C) The relative expression level of INHBA, OPRK1 and TPBG between PE group and non-PE group. (D) The correlation among INHBA, OPRK1 and TPBG.

