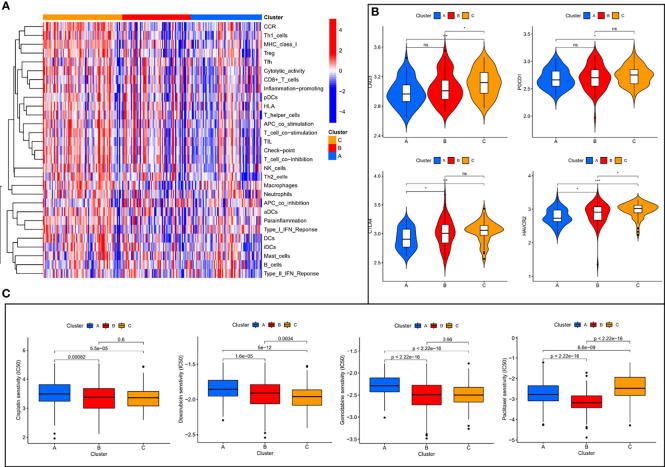
Figure 3.
Immune characterization analysis and drug sensitivity analysis of molecular subtypes. (A) The expression of immune function between different subtypes. (B) The expression levels of immune checkpoint genes between different subtypes. (C) The boxplot of sensitivity of common chemotherapy drugs in different subtypes. ns, not significant, *P < 0.05, **P < 0.01, ***P < 0.001.

