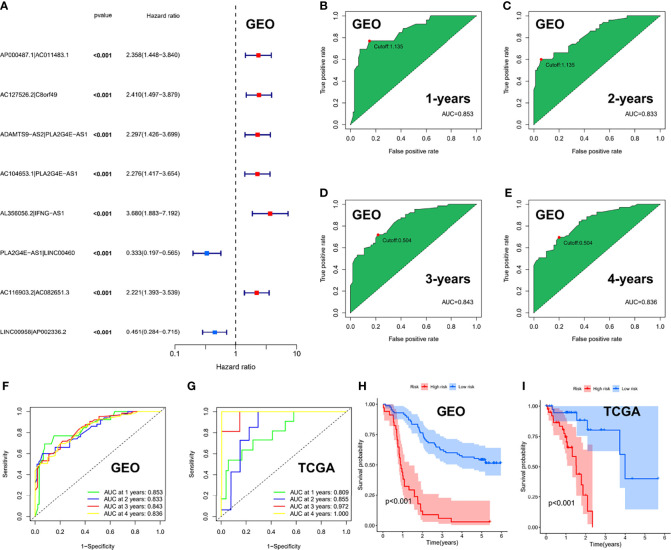
Figure 5.
Risk-score model based on ER-lncRNA pairs in ESCC. (A) Forest plot of eight prognostic-related ER-lncRNA pairs through univariate Cox analysis in the GEO cohort. (B-E) The AUC value of the risk score. (F, G) ROC curve analysis of the accuracy of the model to predict patient prognosis at 1, 2, 3, and 4 years in the GEO cohort (F) and the TCGA cohort (G). (H, I) Kaplan-Meier survival curves for ESCC patients from the GEO and TCGA cohorts, stratified according to cut-off value (high vs. low).

