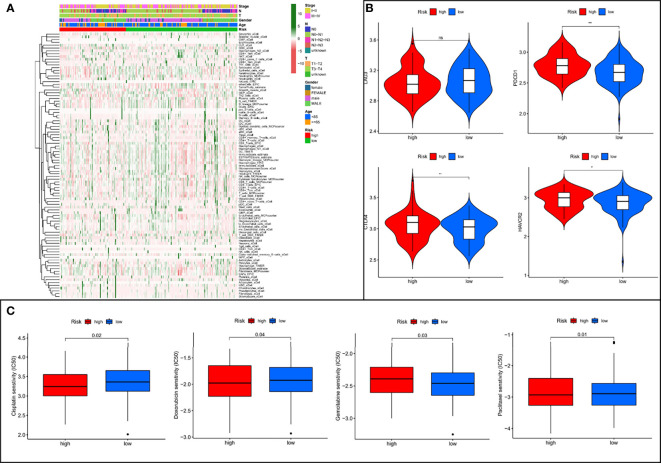
Figure 8.
The low- and high-risk groups display different immune landscape, expression levels of immune checkpoint genes, and chemotherapy drug sensitivity. (A) Heat map showing the difference in the immune landscape between the low- and high-risk groups. (B) The expression levels of immune checkpoint genes between high- and low-risk groups. (C) The boxplot of sensitivity of common chemotherapy drugs between high- and low-risk groups. ns, not significant, *P < 0.05, **P < 0.01.

