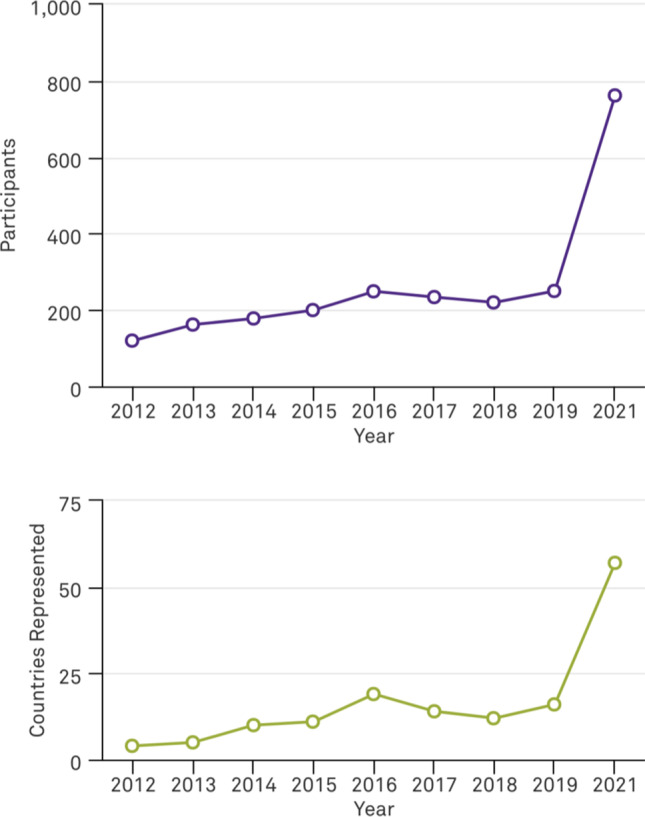
Fig. 1.

Graphs illustrating the growth of the conference in terms of A number of participants and B numbers of countries represented. The number of countries represented is based on self-reported registration information. The change to a virtual format increased overall participation and accessibility. (Note there was no conference in 2020 due to the COVID-19 pandemic.)
