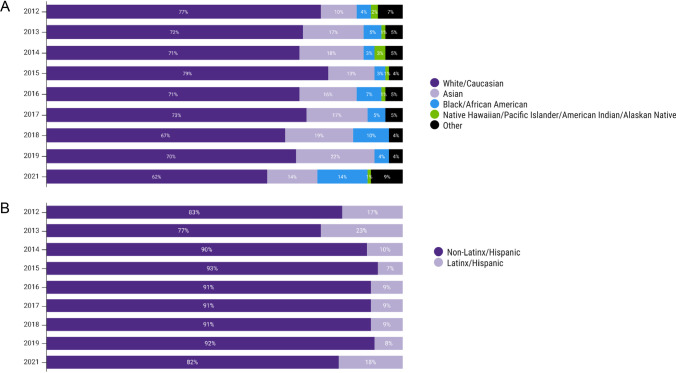
Fig. 3.
Graphs illustrating the self-reported demographic data from conference attendees from 2012–2021 including A race and B ethnicity/origin. All data was self-reported and collected at the time of conference registration. Race and ethnicity were not required fields on the data registration form. Percentages are calculated based on individuals who completed these fields on their registrations. Calculations were based on the following number of responses per year: 2012: 97; 2013: 112; 2014: 151; 2015: 186; 2016: 219; 2017: 204; 2018: 200; 2019: 231; 2021: 663

