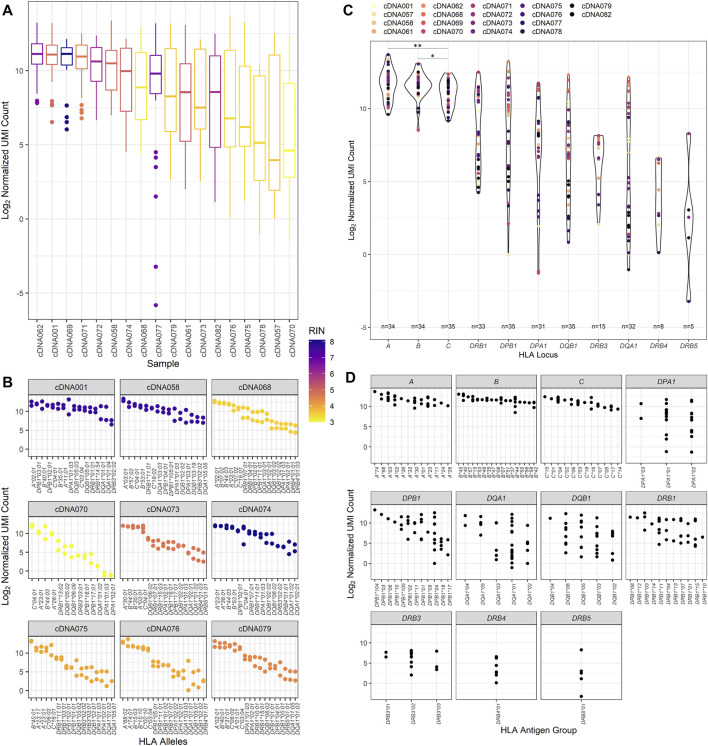
FIGURE 3.
RNA expression of the patient cohort as counted by unique molecular identifier. (A) The normalized UMI count distribution for each patient sample corresponding to the calculated RNA integrity number. (B) The distribution of the normalized UMI counts across several representative patient HLA alleles and their corresponding calculated RNA integrity numbers. All nine of these patient samples were used to evaluate interassay precision, and these data are reflected on the respective patient plots. (C) Normalized UMI counts at each of the classical HLA loci (*p value <0.05, **p value <0.01). (D) The distribution of the UMI counts obtained for each HLA allele typed for the classical HLA loci for the study patient cohort.

