
Figure 5: Few RNA changes associated with microglial-specific ApoE knock-out.
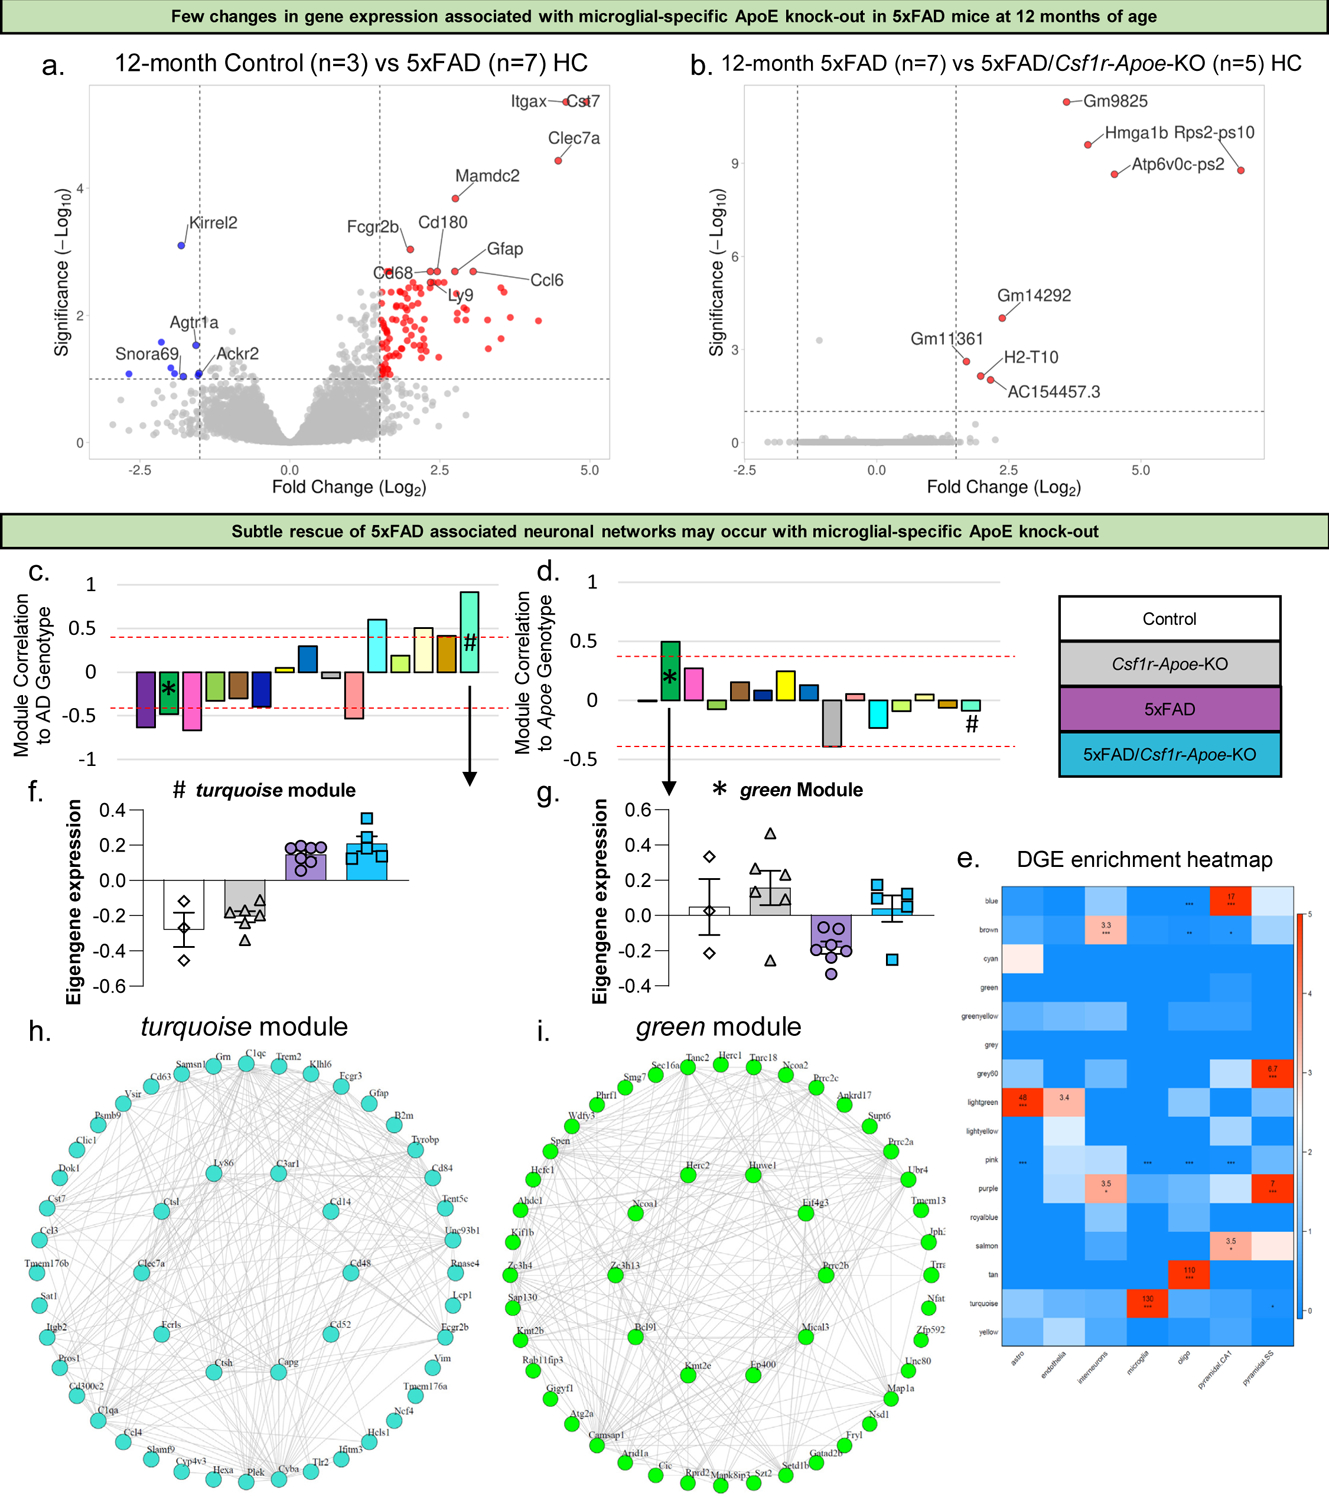
Volcano plot showing higher expression of inflammatory and other AD associated genes in the hippocampus of 5xFAD mice (n=7) compared to Control mice (n=3) at 12 months of age (a). Volcano plot showing very few changes in gene expression between 5xFAD (n=7) and 5xFAD/Csf1r-Apoe-KO (n=5) mice at 12 months of age (b). Correlation of modules generated by weighted gene correlation network analysis (WGCNA) to the AD genotype (Z-score cut-off: +/−0.4; * = green module; # = turquoise module) (c). Correlation of modules generated by WGCNA to Apoe genotype (Z-score cut-off: +/−0.4) (d). Cell-type enrichment heatmap displays genes associated with specific cell types within a given color module (e). Values provided indicate the number of genes within the network associated with that of a specific cell type. *** = 6+ genes. ** = 3+ genes. Module eigengene trajectory of gene expression value in turquoise (f) and green (g) modules. Interactive plot between hub genes extracted from the turquoise module showing a distinct AD signature (h). Interactive plot between hub genes extracted from the green module showing a distinct signature associated with Apoe knock-out (i).