Fig. 1.
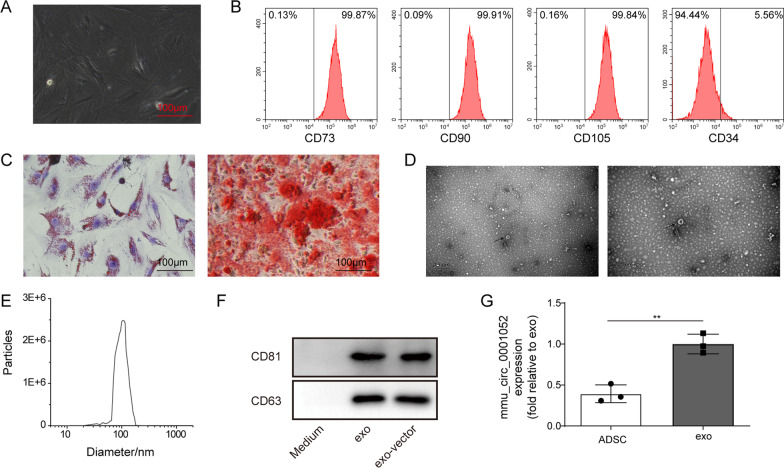
The characterization of ADSCs and exosomes. A morphology of ADSCs. B detection of surface markers of ADSCs by flow cytometry. C the osteogenic and adipogenic differentiation via oil red o and alizarin red. D appearance of exosomes via transmission electron microscope. E diameter of exosomes via dynamic light scattering. F biomarkers (CD63 and CD81) via western blot. G the expression of mmu_circ_0001052 in ADSCs and exosomes via real-time PCR. All data were obtained from at least three replicate experiments. *P < 0.05, **P < 0.01. Medium mean the medium after extracting exosomes. N = 3. Comparison between two groups was processed with independent sample t test. One-way ANOVA was used to analyze the differences among three groups. Afterward, post-pairwise comparison was conducted by Dunnett’s multiple comparison test

