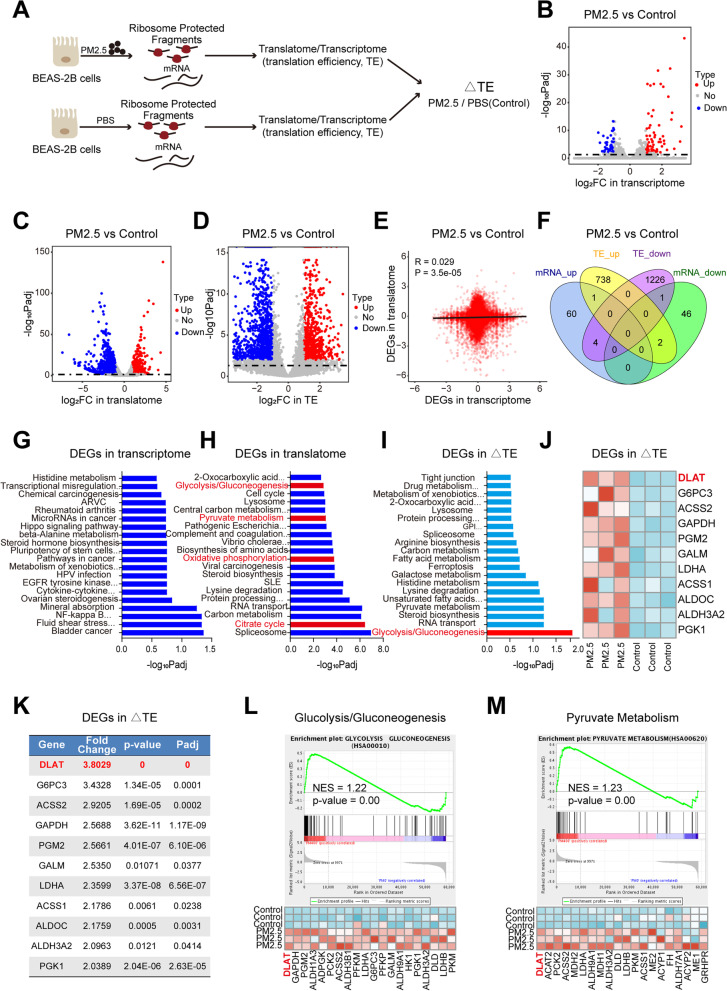
Fig. 1.
PM2.5 induces a translation efficiency (TE) shift towards up-regulation of glycolysis pathway genes. A Overview of experiments for RNA-seq and Ribo-seq in BEAS-2B cells following PM2.5 exposure. B Volcano map of differentially expressed genes (DEGs)in RNA-seq. Red and blue dots represent the upregulated and downregulated genes, respectively (FDR<0.05; |Log2(fold change)| >1). C Volcano plot of DEGs in Ribo-seq. D Volcano plot showing genes with significant changes in TE. E Genome-wide transcriptional and translational regulations showed very little correlation. F The four-way Venn diagram represented the different subsets of genes that are significantly upregulated or down-regulated at the TE and transcription levels. G KEGG pathway analysis of DEGs in transcriptome (RNA-seq). H Pathway analyses on DEGs in translatome revealed a shift towards glycolysis-related pathways. I Glycolysis/gluconeogenesis pathway was the only significantly enriched pathway in genes with TE changes. J Heatmap of DEGs in TE in the “Glycolysis/gluconeogenesis pathway”. K Fold change of TE for glycolytic genes between PM2.5-exposed cells and control cells. L Gene set enrichment analysis (GSEA) of Ribo-seq data showing the enrichment of glycolysis/gluconeogenesis pathway (upper) and the gene signature (lower) in PM2.5-exposed cells, with DLAT as the top up-regulated gene. M GSEA of Ribo-seq data revealing the enrichment of pyruvate metabolism pathway (upper) and the gene set in PM2.5-exposed cells, with DLAT ranking as the top gene. NES, normalized enrichment score

