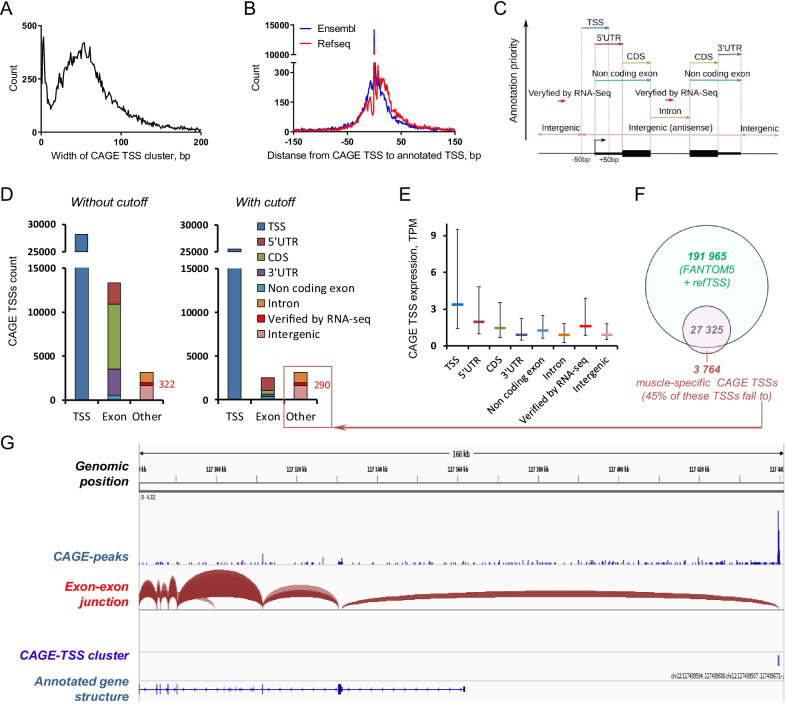
Fig. 1.
Annotation of cap analysis of gene expression (CAGE) transcription start site (TSS) clusters. A. CAGE TSS clusters showed the classical distribution to “sharp” and “broad” classes. B. Distribution of distance from CAGE TSS clusters to TSSs annotated in Ensembl and RefSeq (most of our CAGE TSS clusters fall between ± 50 bp from annotated TSSs). C. Location of CAGE TSS clusters (ordered by priority) versus gene annotation. Additionally, putative alternative starts were verified using the coverage and exon–exon junction (RNA sequencing data) and annotated to corresponding genes. D. Number of CAGE TSS clusters annotated to different locations before (left panel) and after (right panel) elimination of low-abundance CAGE TSS clusters. E. Expression (median and interquartile range) of CAGE TSS clusters annotated to different locations. F. Overlap of CAGE TSS clusters from the FANTOM5 and refTSS projects with those in our study and 3764 first defined (probably muscle-specific) CAGE TSS clusters. G. Analysis of the coverage and exon–exon junctions for the first exon (RNA sequencing data; example for the NOS1 gene) allows the annotation, for the first time, of 290 CAGE TSS clusters belonging to 163 genes. CDS, coding sequence

