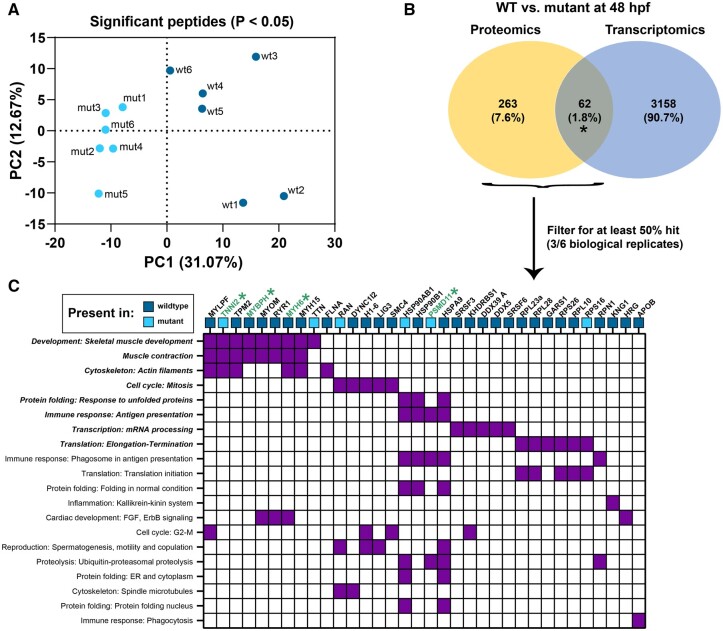
Figure 9.
Whole-animal proteomic comparison between wild-type (WT) and wfikkn1 mutant zebrafish at 48 hpf. A, PCA plot of 6 biological replicates of the wild-type (wt) and wfikkn1 (mut) significant peptides (false discovery rate [FDR] p < .05). B, Comparison between genes of proteins predicted from significant peptides (FDR p < .05; proteomics) and significant differentially expressed genes (FDR p < .05; transcriptomics). C, Heatmap showing MetaCore process networks (significant processes are bolded) on the y-axis, and proteins from proteomic and transcriptomic (*) datasets on the x-axis. Blue boxes represent proteins expressed in at least 3 biological replicates of WT or mutants and absent in all replicates of the other genotype.

