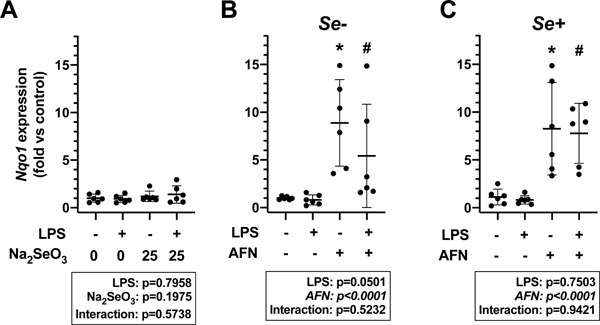
Figure 3. Nqo1 expression.
A) MH-S cells were cultured for 72h in RPMI media containing 2.5% FBS supplemented with 0 or 25 nM Na2SeO3 and treated with 0.05 μg/mL LPS or vehicle for 4h. MH-S cells were cultured in RPMI media containing 2.5% FBS supplemented with (B) 0 (Se-) or (C) 25 nM Na2SeO3 (Se+) for 4 h in the presence or absence of 0.05 μg/mL LPS and/or 0.5 μM AFN. Data (mean ± SD, n=6) were analyzed by two-way ANOVA followed by Tukey’s post hoc analysis (*p<0.003 vs control; #p<0.003 vs LPS alone).

