
FIGURE 2.
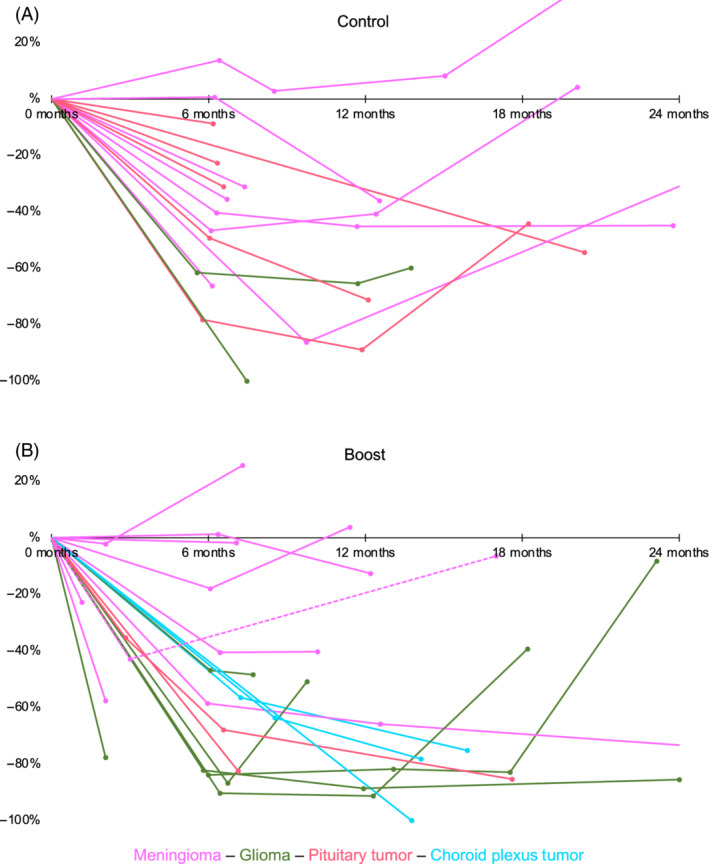
Changes in relative tumor volumes in the first 2 years after treatment, split by group (A, control group; B, SIB group), ITT population. Each dot represents an imaging time point, and each line corresponds to an individual dog with follow‐up imaging, the initial GTV representing the baseline value (ie, before treatment). In the first 24 months after treatment, 36 dogs (control group: n = 16, SIB group: n = 20) had at least one follow‐up imaging. The connecting lines are for better visualization and do not reflect a linear volume change between scan time points. Changes in the relative tumor volume after treatment of relapses are not shown. The dashed line represents the single case that was randomized to the SIB group but was treated conventionally after withdrawal of owner consent. Because this dog is analyzed as part of the SIB group according to the ITT approach, it also has been included in this graph