
FIGURE 3.
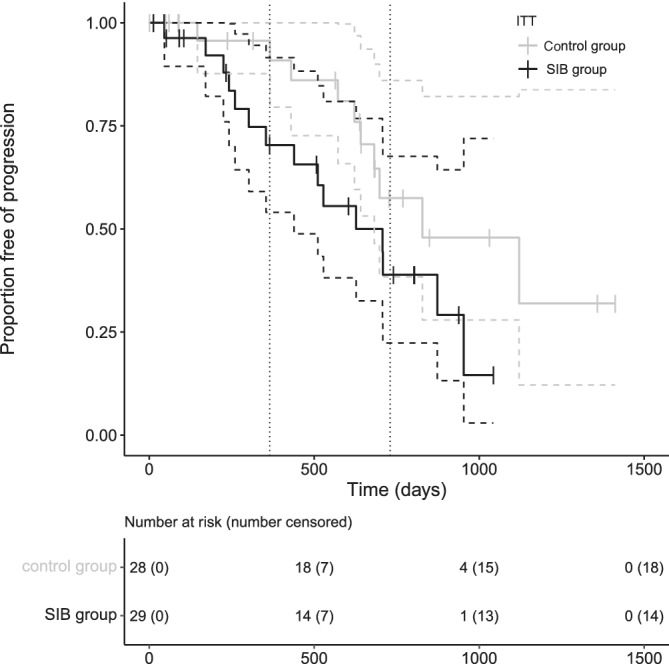
Time to progression Kaplan‐Meier curves of the dogs (ITT population) split by protocol: the black line represents the SIB protocol with median TTP of 627 days (95% CI [282,973]), the gray line the control protocol with median TTP of 828 days (95% CI [401,1256]). There was no significant difference between protocols (P = .07). The tick marks represent censored cases, the vertical dotted lines mark 1 and 2 years