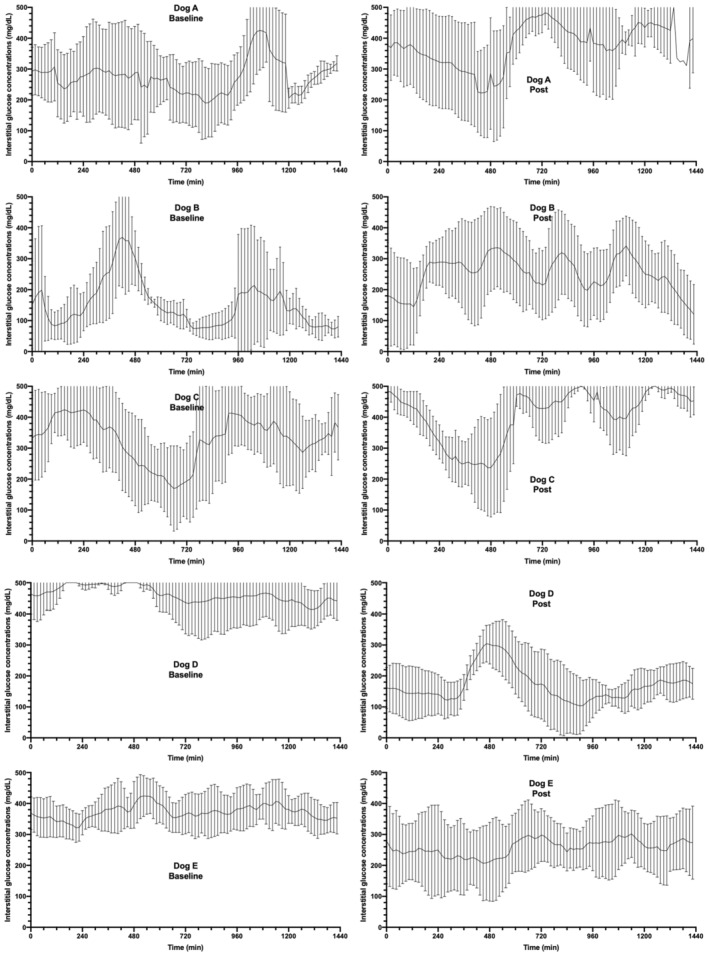
FIGURE 2.

Mean interstitial glucose concentrations in 5 dogs treated with twice daily prestudy insulin (left panels: baseline) and after 7 doses (Dogs A and E) or 8 doses (Dogs B‐D) of once‐weekly AKS‐218d insulin (right panels: "Post". i.e.,final week). Each time point represents the 15‐minute mean IG over 6 days, with the line representing the mean IG and the error bars representing the SD. The X axis represents 24 hours in total
