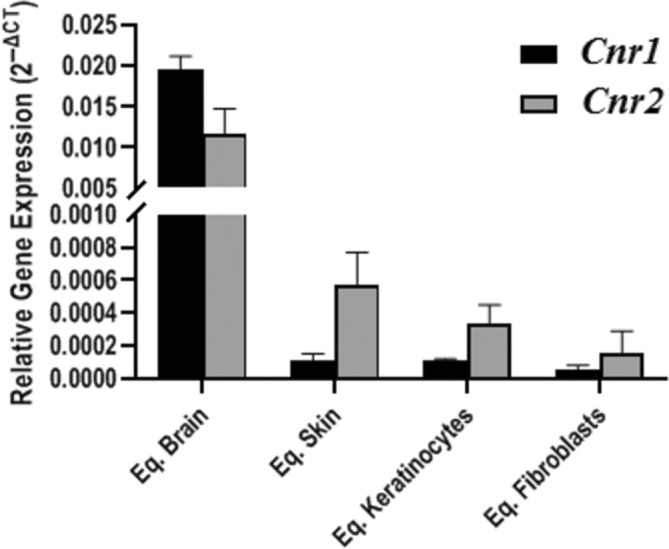
FIGURE 9.

Comparison of the relative expression level of Cnr1 and Cnr2 in equine brain (Eq. Brain); skin (Eq. Skin); keratinocytes (Eq. Keratinocytes) and fibroblasts (Eq. Fibroblasts). The transcript level in each biological sample is displayed as the mean value of 2−ΔCT ± SEM
