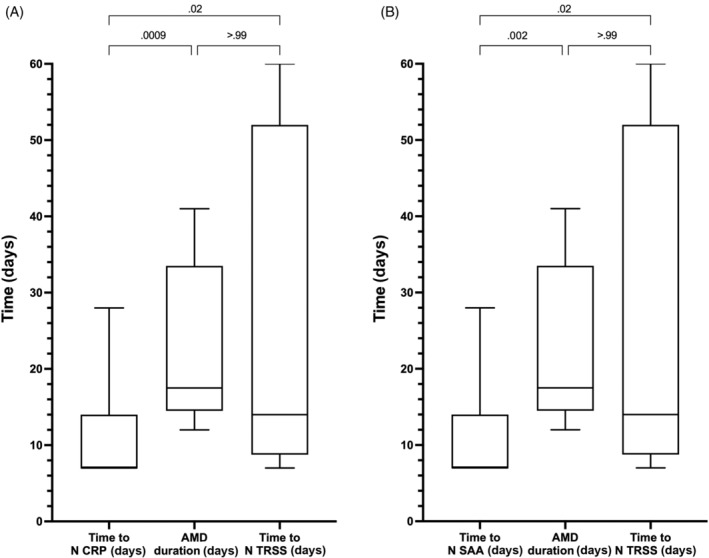
FIGURE 2.

(A) Box/whisker plots of the time (days) to normalization of C‐reactive protein (CRP) concentrations, the duration of antimicrobial drug (AMD) administration and the time to normalization (N) of the thoracic radiograph severity score (TRSS). (B) Box/whisker plots of the time (days) to normalization of serum amyloid A (SA) concentrations, the duration of AMD administration and the time to normalization of the TRSS. Central horizontal lines represent the median, boxes represent the 25% to 75% range, and whiskers represent the minimum and maximum values. Comparisons between these data were performed using the Friedman test with Dunn's post‐hoc correction for multiple comparisons, with corresponding P‐values listed on the figure panels
