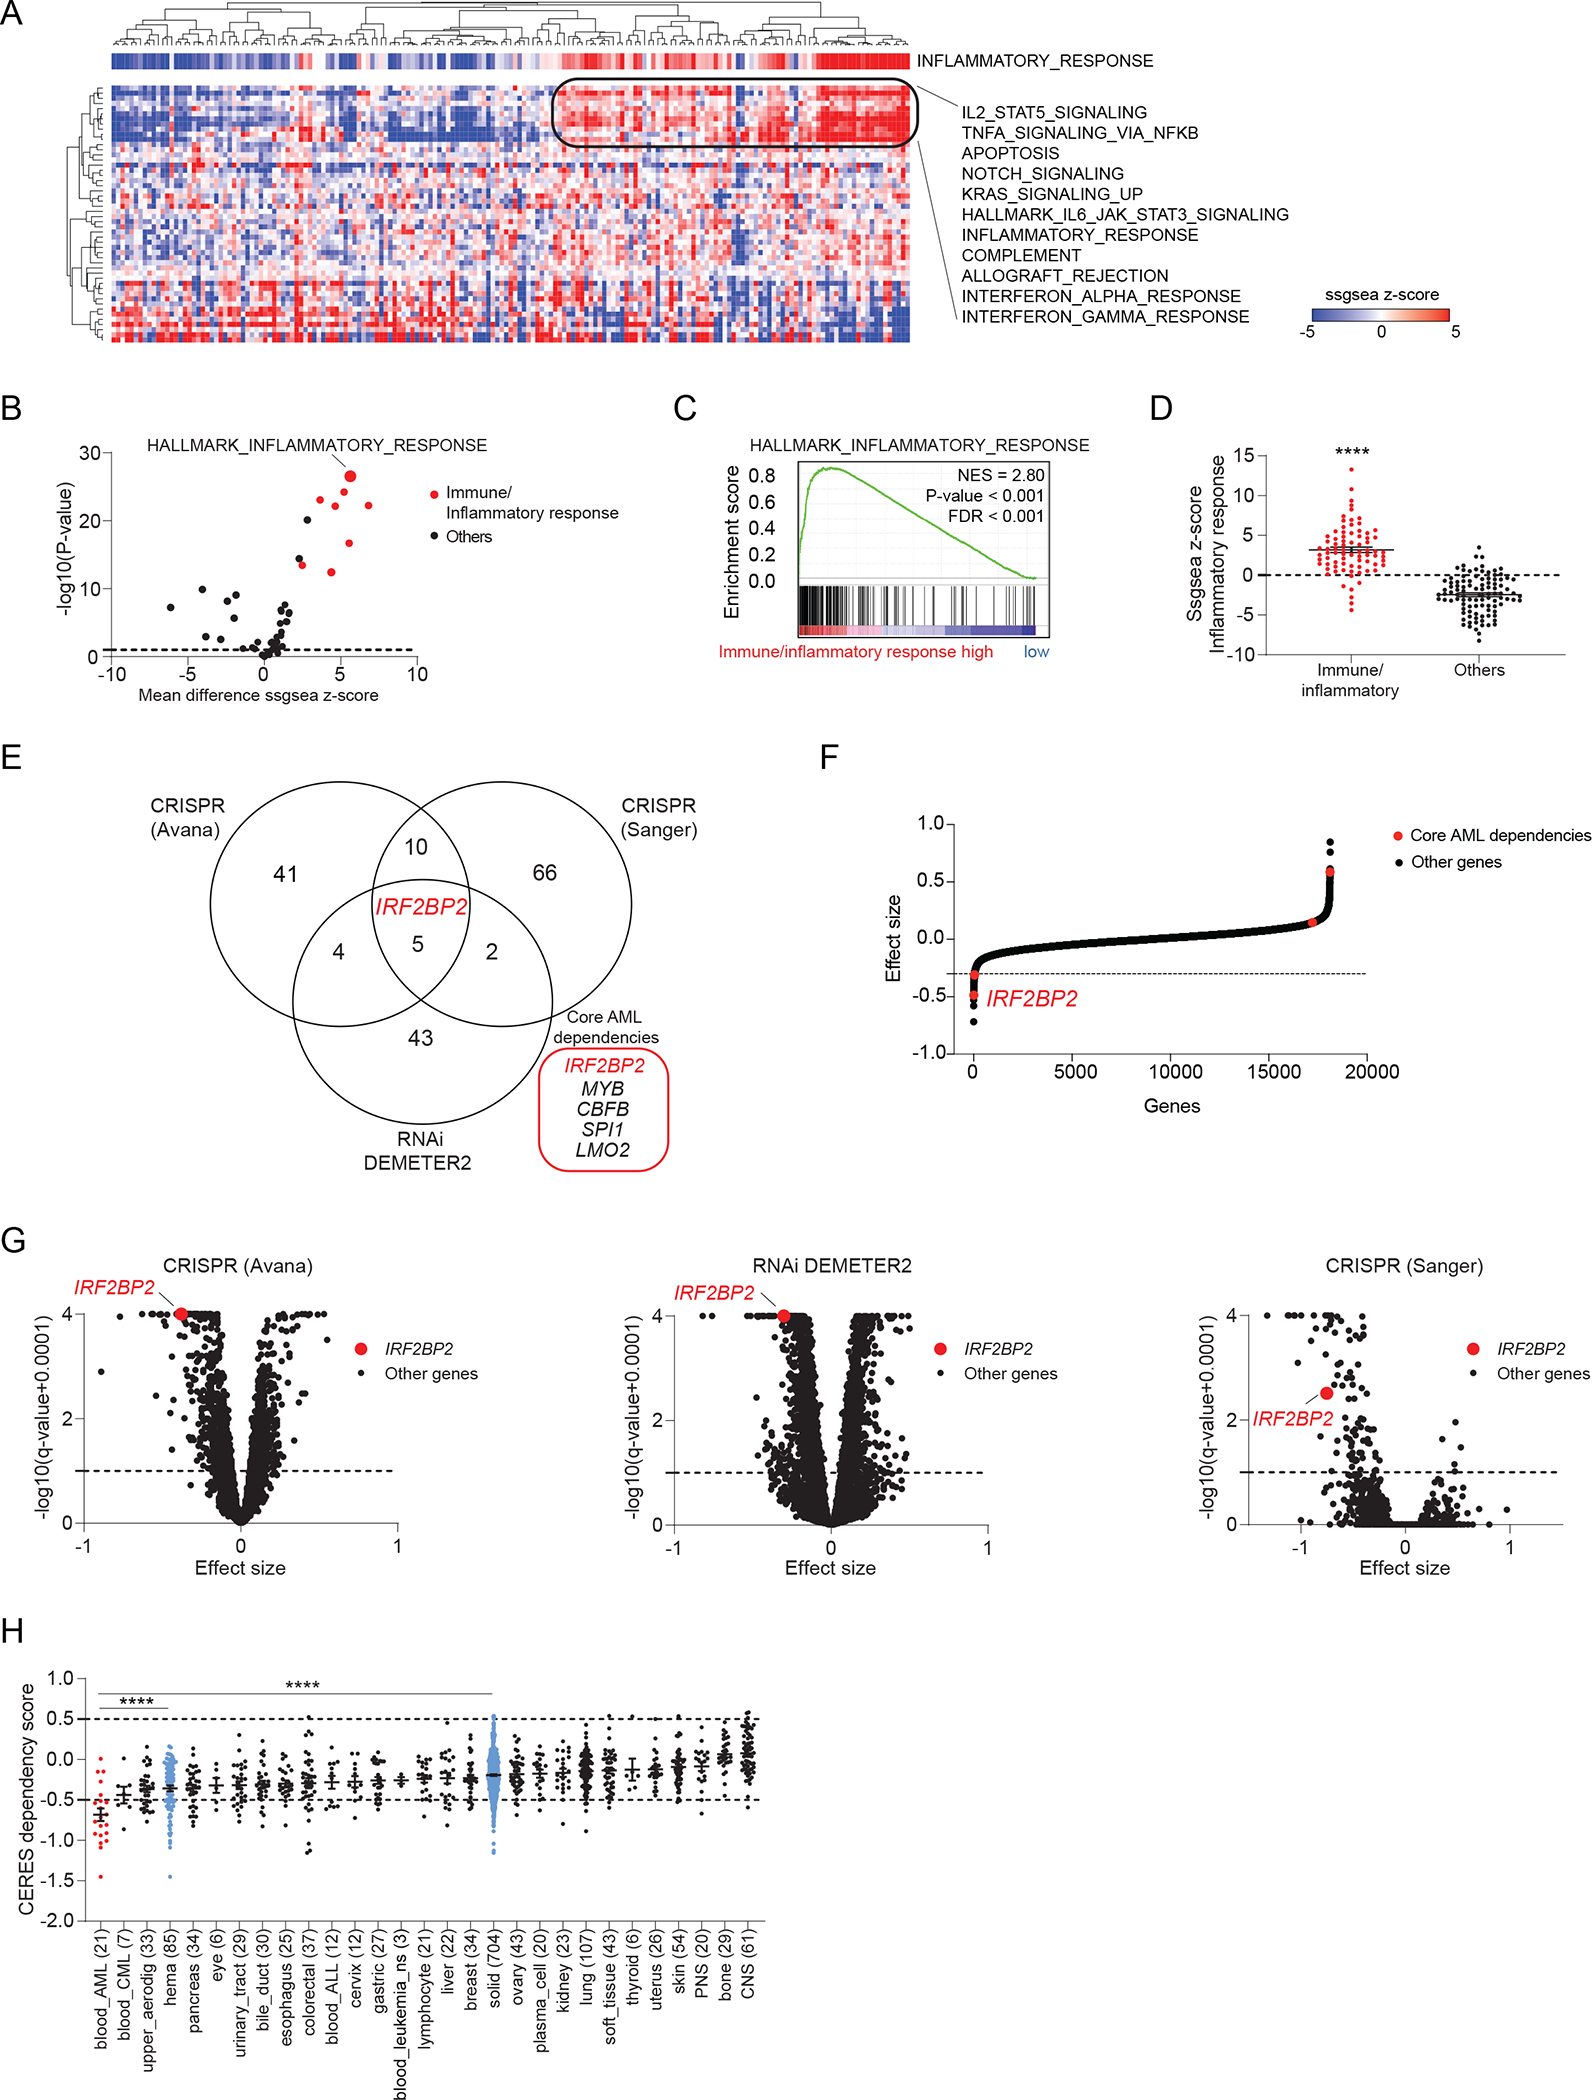
Figure 1. Enrichment analysis for inflammatory pathways identifies an AML subgroup and uncovers IRF2BP2 as a selective immune dependency.

A, Heatmap depicting the single sample GSEA (ssGSEA) projection of the Cancer Genome Atlas (TCGA) Acute Myeloid Leukemia (LAML) expression data for 179 AML samples on the collection of 50 hallmark gene sets (MSigDB v7.1), defining a cluster of AML samples enriched for immune/inflammatory pathways. AML samples are annotated with the ssGSEA scores for HALLMARK_INFLAMMATORY_RESPONSE. Data are clustered according to the hierarchical clustering for Spearman rank correlation. Top scoring hallmark gene sets within the cluster with strong enrichment for immune/inflammatory response are listed next to the heatmap.
B, Volcano plot depicting the differential enrichment of the ssGSEA projection on hallmark gene sets for AML samples enriched for immune/inflammatory pathways (defined as shown in panel A) compared to all other AML samples within TCGA LAML collection. Highlighted in red are the immune/inflammatory hallmarks gene sets. Limma eBayes, |effect size| ≥ 0.5, p-value ≤ 0.10.
C, GSEA plot for HALLMARK_INFLAMMATORY_RESPONSE enrichment in the genome-wide list of genes ranked by differential expression in AML samples enriched for immune/inflammatory pathways (defined as shown in panel A) compared to all other AML samples within the TCGA LAML collection. GSEA significance cut-offs: |Normalized Enrichment Score (NES)| ≥ 1.3, p-value ≤ 0.05, FDR ≤ 0.25.
D, Scatter dot plots depicting the HALLMARK_INFLAMMATORY_RESPONSE ssGSEA scores for AML samples enriched for immune/inflammatory pathways (defined as shown in panel A) compared to all other AML samples within TCGA LAML. T-test with Welch correction, **** p < 0.0001.
E, Venn-diagram depicting the overlap between gene dependencies enriched in AML identified in three independent data sets: 60 AML dependencies identified in the CRISPR (Avana) 20Q3 public data on 789 cell lines, 54 AML dependencies identified in the Combined RNAi (Broad, Novartis, Marcotte) 20Q3 DEMETER2 public data on 712 cell lines, and 83 AML dependencies identified in the CRISPR (Sanger) 20Q3 public data on 318 cell lines. The number of AML cell lines among all screened cancer cell lines is indicated for each data set. AML enriched dependencies were identified by limma eBayes, |effect size| ≥ 0.3, q-value ≤ 0.1.
F, Hockey stick plot depicting the differential CERES dependency scores in AML cell lines with a strong monocytic signature compared to all other AML cell lines in the CRISPR (Avana) data. Core dependencies are highlighted in red. IRF2BP2 scores as the strongest core dependency (most negative score) among monocytic AML cell lines. Significance |effect size| ≥ 0.3, q-value ≤ 0.1.
G, Volcano plots depicting the gene dependency status for AML versus other lineages across three independent screens. Left: CRISPR (Avana) 20Q3 CERES data set; middle: Combined RNAi 20Q3 DEMETER2 data set; right: CRISPR (Sanger) 20Q3 data set. Effect sizes of all other genes within AML are shown as black; IRF2BP2 is highlighted in red (limma eBayes, |effect size| ≥ 0.3, q-value ≤ 0.10).
H, Boxplots depicting the IRF2BP2 CERES dependency scores across the cell line lineages in the CRISPR (Avana) 20Q3 data. Lineages are ranked by increasing mean IRF2BP2 CERES dependency scores. The lower the CERES score, the greater the dependency; a score below −0.5 indicates gene dependency. Differential dependencies were assessed by one-way ANOVA, Tukey’s multi-comparison test, **** p < 0.0001.
