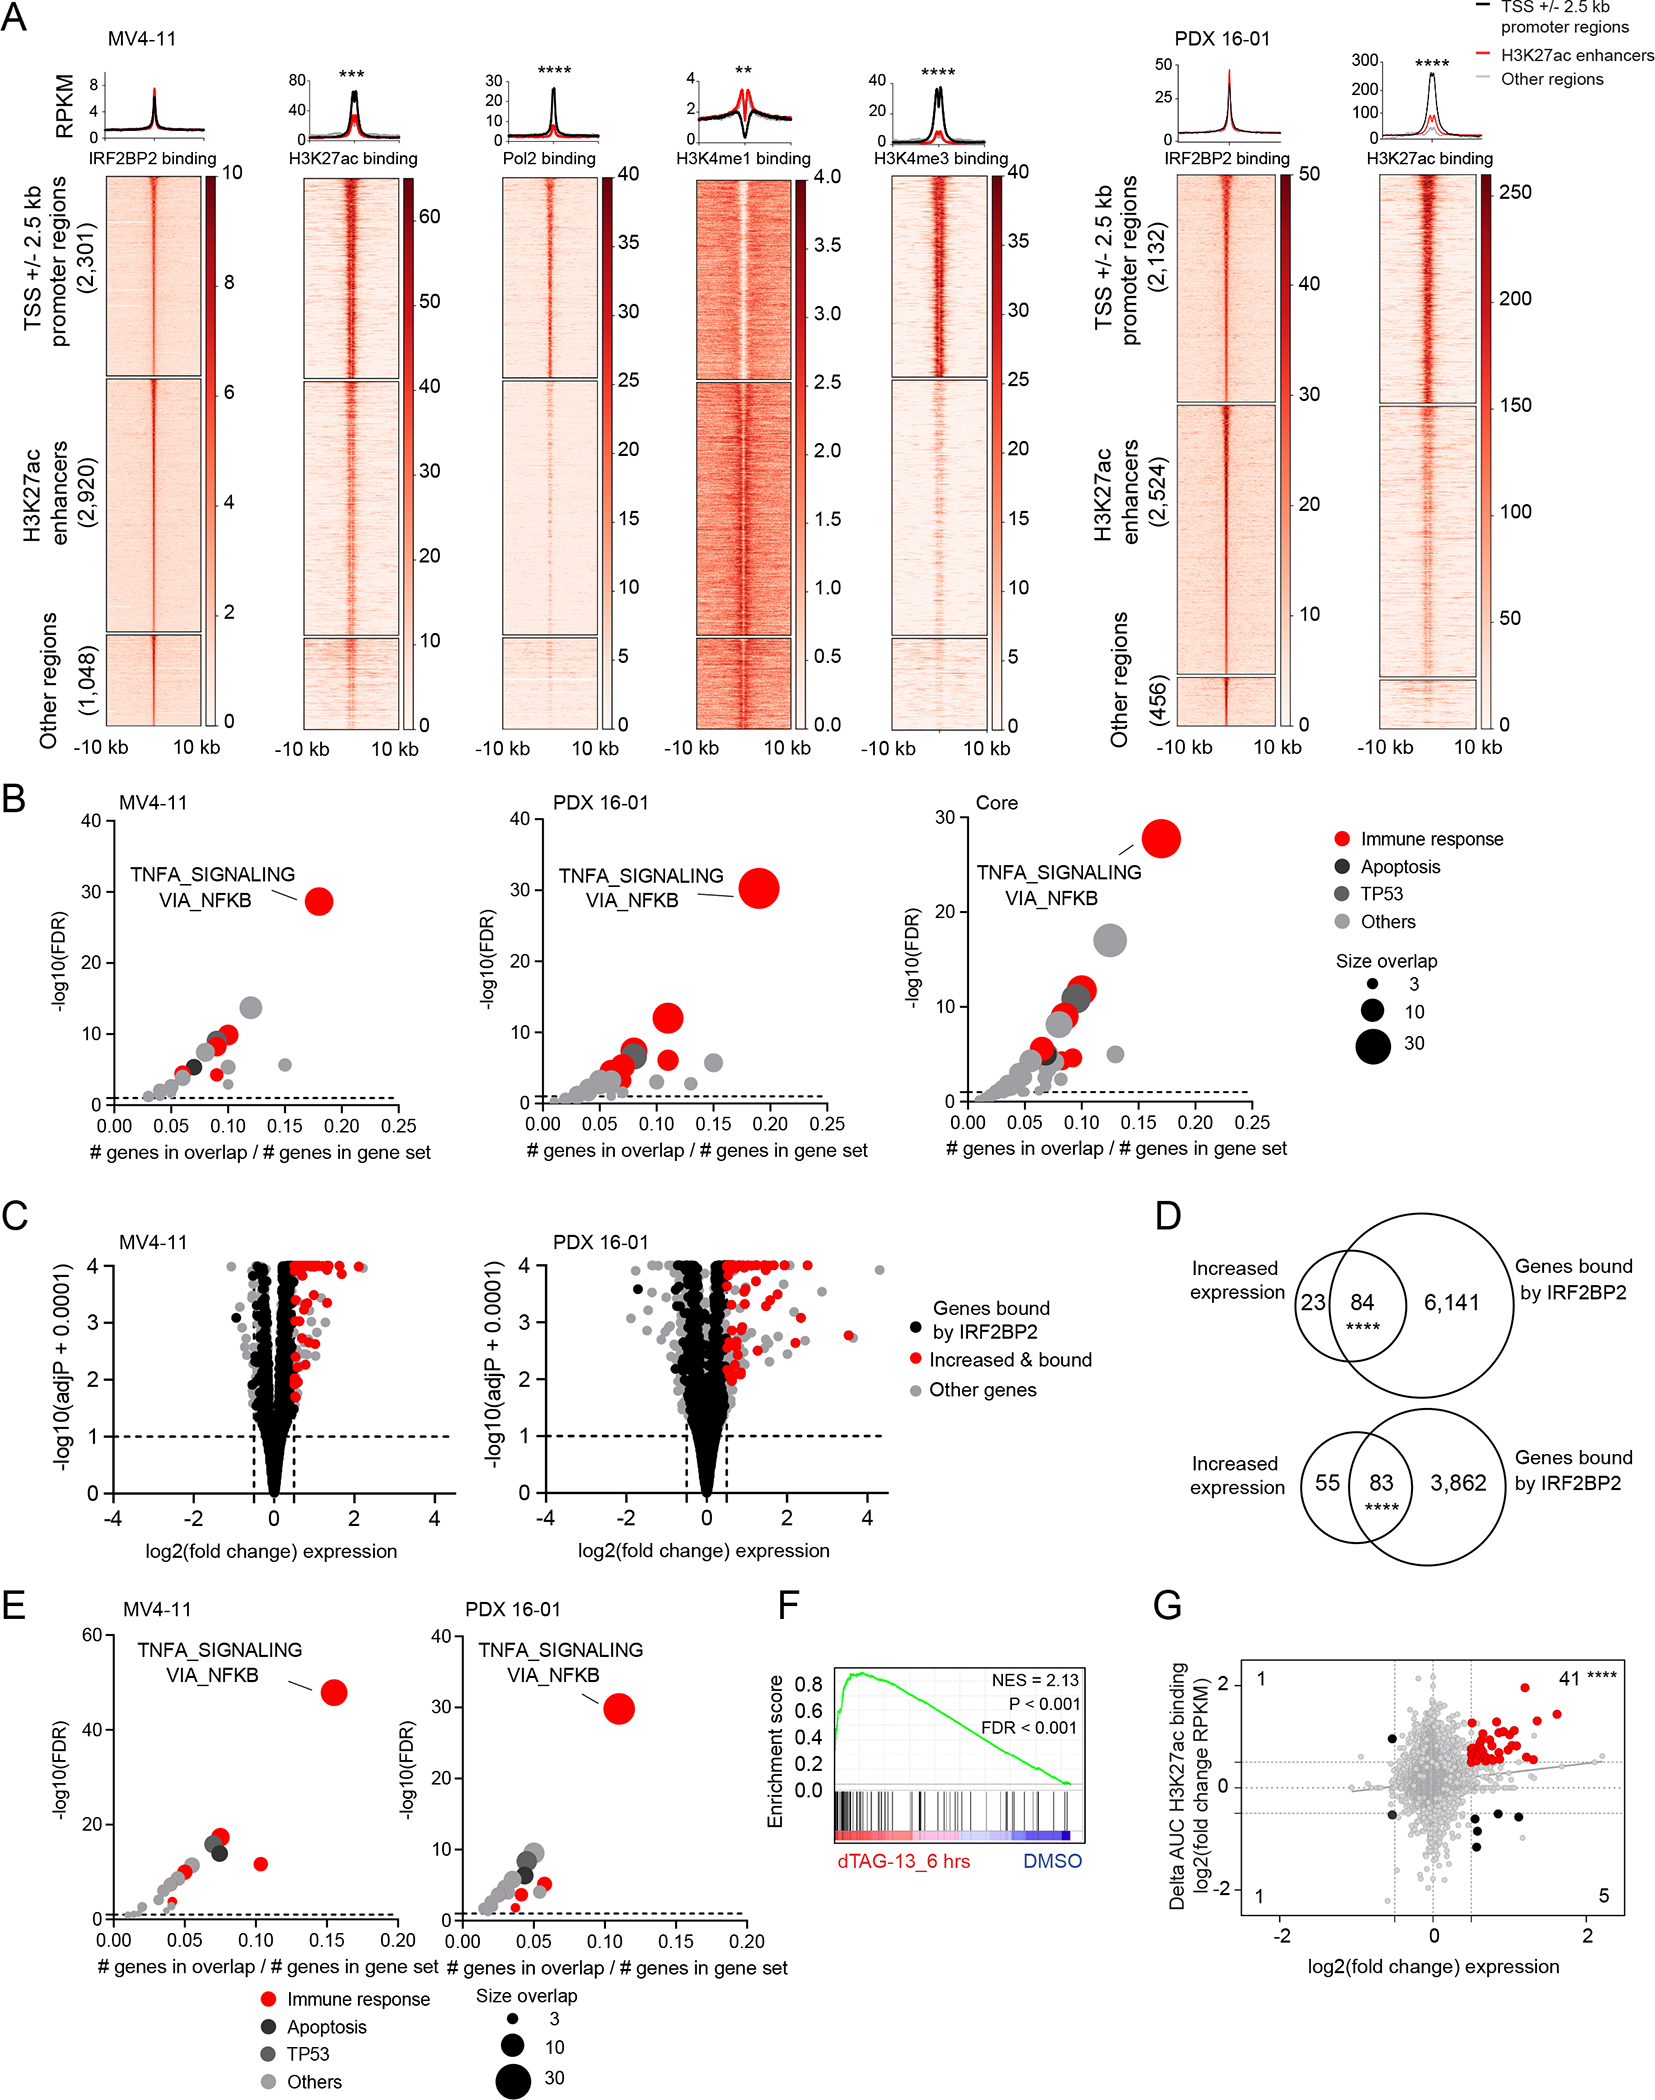
Figure 5. IRF2BP2 represses immune response genes in AML.

A, Clustered heatmaps and metaplots showing genome-wide IRF2BP2 chromatin binding +/− 10 kb regions in MV4-11 cells (left) and PDX 16-01 (right). Heatmaps showing area under the curve RPKM normalized signal for IRF2BP2, H3K27ac, Pol2, H3K4me1 and H3K4me3 binding for MV4-11 cells, and area under the curve RPKM normalized signal for IRF2BP2 and H3K27ac binding in PDX 16-01. The IRF2BP2 binding sites were grouped into three clusters based on the promotor/enhancer status: promoter regions (TSS +/− 2.5kb), enhancers, and other regions, depicting peaks not classified as promotors or enhancers. Clustered regions were ranked by IRF2BP2 signal. Read density metaplots are showing average RPKM normalized signal for IRF2BP2, H3K27ac, Pol2, H3K4me1 and H3K4me3 in promotor regions (black), H3K27ac enhancers (red) and other regions (gray). Differential read density in promotor versus H3K27ac enhancer regions was evaluated by unpaired t-test with Welch’s correction, **** p < 0.0001, *** p < 0.001, ** p < 0.01.
B, Bubble plots summarizing the significant enrichments of the MSigDB v7.1 collection of 50 hallmark pathways within the top 500 nearest genes bound by IRF2BP2 (macs2, FDR ≤ 0.01), defined by normalized area under the curve signal ranking. Left panel: IRF2BP2 binding in MV4-11 cells, middle panel: IRF2BP2 binding in PDX 16-01 cells, right panel: core intersection of IRF2BP2 binding regions in MV4-11, THP1, PDX 16-01 and PDX 17-14. Enriched gene sets are clustered in functional categories indicated by the color code; red indicates immune response signatures. The bubble size indicates the number of overlapping genes. Hypergeometric test, p ≤ 0.05, FDR ≤ 0.05.
C, Volcano plots depicting the gene-level differential transcriptional status after degradation of IRF2BP2 for 6 hours in MV4-11 cells (left) and PDX 16-01 cells (right). Red dots represent genes that are bound by IRF2BP2 and increased in expression. Black dots represent all other genes that are bound by IRF2BP2. Grey dots depict all other genes. Shown per gene are log2(fold change expression) versus -log10(adjusted p-value + 0.0001).
D, Venn diagram depicting the overlap of genes with increased expression following degradation of IRF2BP2 for 6 hours (fold change expression ≥ 1.5, adjusted p-value ≤ 0.10) and genes bound by IRF2BP2 (ChIP-seq binding sites, defined by macs2, FDR ≤ 0.10) in MV4-11 cells (upper panel) and PDX 16-01 (lower panel). Two-tailed Fisher exact test, **** p < 0.0001. E, Bubble plots summarizing the significant enrichments in MSigDB v7.1 collection of 50 hallmark pathways within the IRF2BP2 bound genes with increased expression following degradation of IRF2BP2 for 6 hours in MV4-11 cells (left) and PDX 16-01 cells (right). Enriched gene sets are clustered in functional categories indicated by the color code; red indicates immune response signatures. The bubble size indicates the number of overlapping genes. Hypergeometric test, p ≤ 0.05, FDR ≤ 0.05.
F, GSEA plot for HALLMARK_INFLAMMATORY_RESPONSE enrichment within IRF2BP2 bound and differentially expressed genes following degradation of IRF2BP2 after treatment with dTAG-13 for 6 hours in MV4-11 cells. NES > 1.3, p-value < 0.001, FDR < 0.001.
G, Scatter plot depicting the overlap between the 1,678 genes with significant changes in H3K27ac binding (Delta(area under curve signal) ≥ 1.5) following treatment with dTAG-13 for 24 hours and genes with increased or decreased expression in MV4-11 cells following treatment with dTAG-13 for 6. Red dots in the right upper quadrant represent 107 genes with increased expression and gain in H3K27ac marking. Statistical significance was tested by two-tailed Fisher exact test, **** p < 0.0001.
