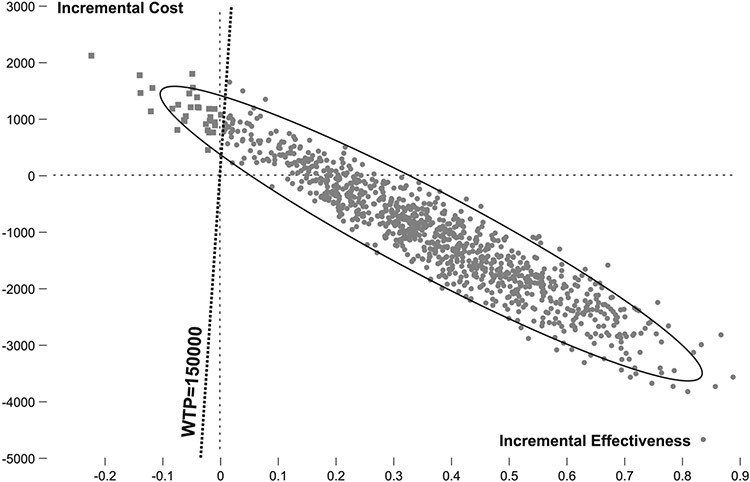
Fig 3.
Probabilistic sensitivity analysis. Results of the PSA are shown on an incremental cost-effectiveness plane. In 97% of 1,000 iterations, the Per Guideline (PG) strategy was either dominant (represented in the right lower quadrant) or cost-effective (represented in the right upper quadrant, to the right of the willingness-to-pay line). Circles represent iterations in which PG is superior, and squares represent iterations in which the Current Adherence strategy is superior.

